172
Views
7
CrossRef citations to date
0
Altmetric
Original Research

Improved biological properties and hypouricemic effects of uricase from Candida utilis loaded in novel alkaline enzymosomes

, , , , , , , , & show all
Pages 3929-3938 | Published online: 23 Jul 2012

Figures & data

Figure 1 Schematic diagram of uricase-containing lipid vesicles (UOXLVs) catalyzing the transformation of uric acid into allantoin.
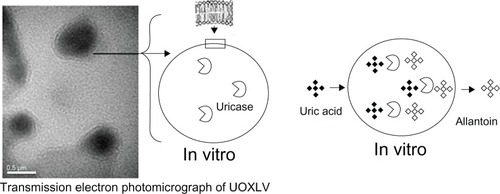
Figure 1 Schematic diagram of uricase-containing lipid vesicles (UOXLVs) catalyzing the transformation of uric acid into allantoin.

Figure 2 Lineweaver–Burk profiles of the uricase-containing lipid vesicles (UOXLVs) and free uricase (n = 3).
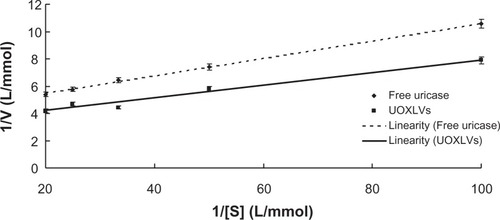
Figure 2 Lineweaver–Burk profiles of the uricase-containing lipid vesicles (UOXLVs) and free uricase (n = 3).

Figure 3 Time courses of the remaining activity of the uricase-containing lipid vesicles (UOXLVs) and free uricase in the presence of plasma (closed squares and triangles, respectively).
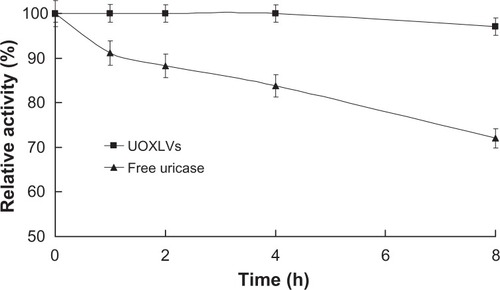
Figure 3 Time courses of the remaining activity of the uricase-containing lipid vesicles (UOXLVs) and free uricase in the presence of plasma (closed squares and triangles, respectively).

Table 1 Pharmacokinetic parameters of uricase-containing lipid vesicles (UOXLVs) and free uricase in rats using a model-independent approach

Figure 4 Plasma uricase activity versus time profiles after intravenous administration of uricase-containing lipid vesicles (UOXLVs) (closed squares) and free uricase (open squares) in rats.

Note: Each point represents the mean ± standard deviation (n = 6).
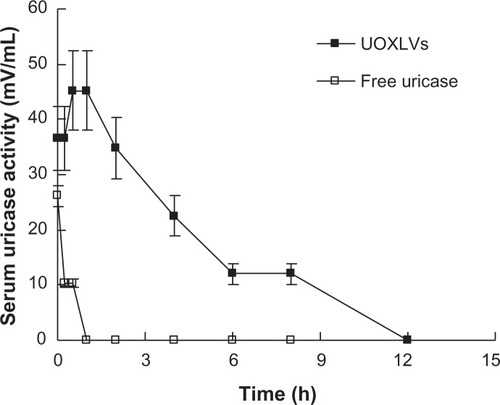
Figure 4 Plasma uricase activity versus time profiles after intravenous administration of uricase-containing lipid vesicles (UOXLVs) (closed squares) and free uricase (open squares) in rats.Note: Each point represents the mean ± standard deviation (n = 6).

Figure 5 The plasma uric acid concentration versus time profiles after intravenous injection of the solvent (normal group, closed squares), hypoxanthine and oxonic acid (hyperuricemia model group, open squares), free uricase (closed triangles), and uricase-containing lipid vesicles (UOXLVs) (open triangles) in rats. The plasma uric acid concentration was determined by uric acid assay kit.

Note: Data are expressed as mean ± standard deviation (n = 6).
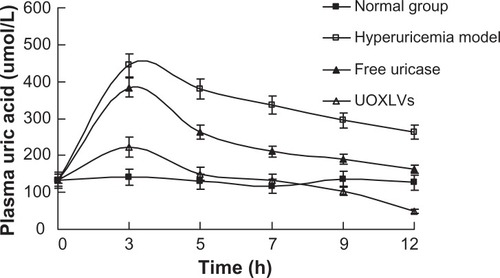
Figure 5 The plasma uric acid concentration versus time profiles after intravenous injection of the solvent (normal group, closed squares), hypoxanthine and oxonic acid (hyperuricemia model group, open squares), free uricase (closed triangles), and uricase-containing lipid vesicles (UOXLVs) (open triangles) in rats. The plasma uric acid concentration was determined by uric acid assay kit.Note: Data are expressed as mean ± standard deviation (n = 6).
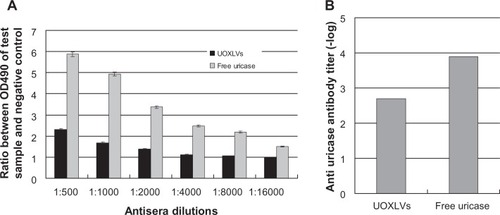
Figure 6 Immunogenicity test results. (A) Antisera dilution ratio; (B) antibody titer.

Note: The data represent the mean ± standard deviation (n = 6).

Abbreviation: UOXLVs, uricase-containing lipid vesicles.

Figure 6 Immunogenicity test results. (A) Antisera dilution ratio; (B) antibody titer.Note: The data represent the mean ± standard deviation (n = 6).Abbreviation: UOXLVs, uricase-containing lipid vesicles.