Figures & data
Figure 1 Investigation of cellular association and transfection efficiency of mRNA-LNPs in vitro. (A and B) Green fluorescent imaging of HEK293T and DC2.4 cells after transfection of RNA-LNP. The RNA-LNP constituted with DOTAP/DOPE/cholesterol lipoplex and EGFP-RNA at various charge ratios. Fluorescent images were collected after transfection from three time points, 24, 48 and 72 h. (C) The fluorescent images of HEK293T and DC2.4 cells after simultaneous transfection of three RNA-LNP, ie DOTAP-DOPE, DOTAP-Chol and LNP3, respectively. (D) Green fluorescent imaging of HEK293T cells after transfection of RNA-LNP3 modified with different molar quantities of DSPE-PEG2000, and the images were collected at three time points, 24, 48 and 72 h. The scale bar was 100 μm.
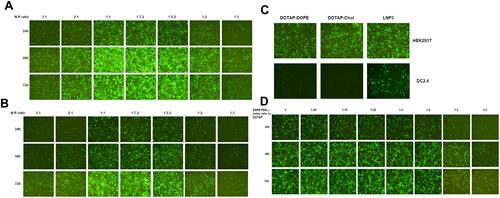
Figure 2 Investigation of buffer-formulated mRNA-LNP3 complex transfection effect. (A) Comparison of different solutions as formulated buffers for mediating mRNA-LNP3 transfection to HEK293T cells. (B) Optimization and development of different formulated buffers based on SPMCG to explore the transfection effect of mRNA-LNP3 complex. The fluorescent images were collected from three time points after transfection, 24, 48 and 72 h. The scale bar was 100 μm.
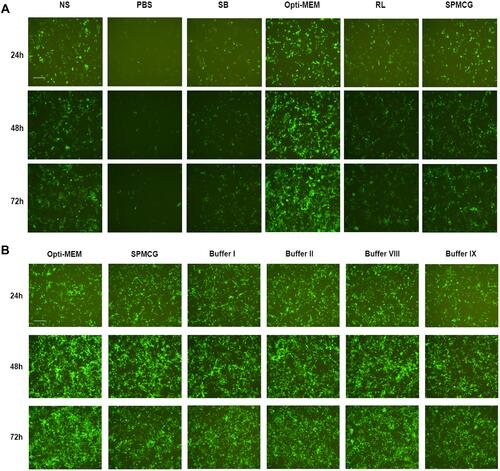
Figure 3 Transfection activity investigation of mRNA-LNP3 after lyophilization and rehydration using Opti-mem as formulated buffer. (A) Effect of sucrose concentration on EGFP mRNA delivery and expression to HEK293T cells mediated by LNP3 during lyophilization and rehydration. (B) Effect on EGFP mRNA-LNP3 transfection to HEK293T cells after lyophilization and storage for a week at different temperatures, in this work, sucrose concentration was 10% (w/v). w/v represents mass to volume ratio, RT represent room temperature. The fluorescent images were collected from three time points after transfection, 24, 48 and 72 h. The scale bar was 100 μm.
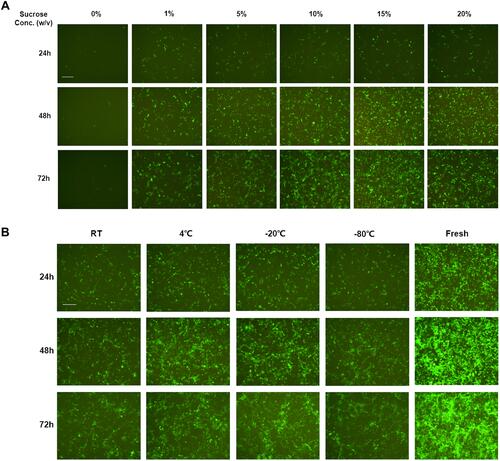
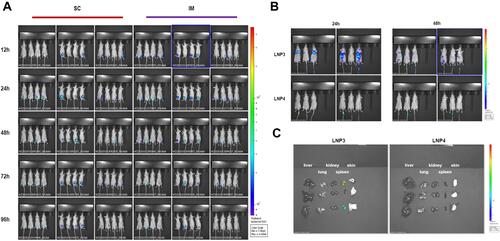
Figure 4 Investigation of biodistribution, sustainability and organ targeting characteristics of lipoplexes in mice following subcutaneous, intramuscular and intravenous administration. (A) Bioluminescence imaging of Balb/c nude mice after SC and IM injection of Fluc mRNA-LNP3. The images collected after transfection at time points of 12, 24, 48, 72 and 96 h. (B) Bioluminescence imaging of Balb/c nude mice after IV injection of Fluc mRNA-LNP3 and Fluc mRNA-LNP4 from two time points, 24 and 48 h, after transfection. (C) Bioluminescence imaging of liver, lung, kidney, spleen and skin in Balb/c mice after IV injection of Fluc mRNA-LNP3 and Fluc mRNA-LNP4, the results were collected 48 h later after transfection.