Figures & data
Table 1 Characteristics of primary antibodies used in this study
Figure 1 siRNA-PKCα intravitreal injection and transfection in mice. (A) Intravitreal injection with a Hamilton syringe, fitted with a 30 G needle. (B) Electricity transfection by square wave electroporator.
Abbreviation: siRNA-PKCα, small interference RNA-protein kinase C-alpha.
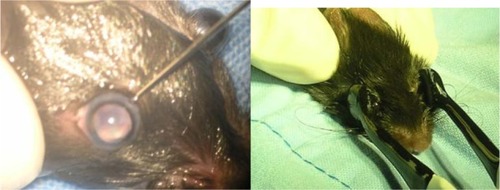
Figure 2 PVR development at 4 weeks after siRNA-PKCα injection. (A) Clinical PVR fundus photographs in the 250 nM and 1500 nM siRNA-PKCα, and in the negative control at the end of the 4-week observation period. Obvious retinal folds, epiretinal membranes, and uneven irises are observed in the 250 nM siRNA-PKCα treatment group, similar to those in the negative group; however, the radial distribution of the retinal arteries and veins are shown in the 1500 nM siRNA-PKCα. (B) Percentage in the five treatment groups and negative control.
Note: The percentages in the 250 nM and negative groups are significantly different from those in the other groups. *P < 0.05.
Abbreviations: PVR, proliferative vitreoretinopathy; siRNA-PKCα, small interference RNA-protein kinase C-alpha.
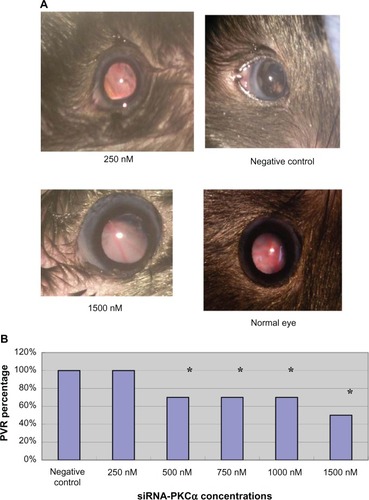
Figure 3 RT-PCR analysis after injection of 1500 nM siRNA-PKCα.
Notes: PKCα messenger RNA was significantly down regulated following siRNA-PKCα injection when compared with those that were dispase-injected or in the control groups (ANOVA, **P = 0.00018 < 0.01, *P = 0.00010 < 0.01). The GAPDH band is used for quantitation.
Abbreviations: RT-PCR, reverse transcription polymerase chain reaction; siRNA-PKCα, small interference RNA-protein kinase C-alpha; PKCα, protein kinase C-alpha; RNA, ribonucleic acid; ANOVA, analysis of variance; GAPDH, glyceraldehyde 3-phosphate dehydrogenase.
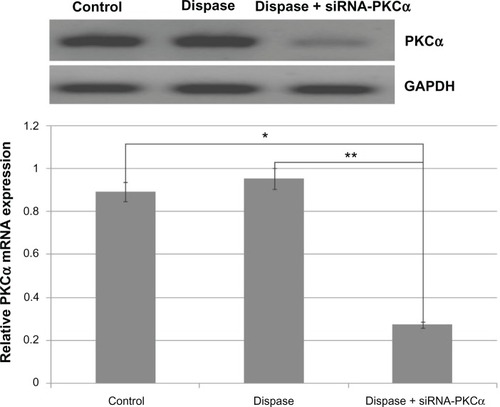
Figure 4 PKCα protein changes after siRNA-PKCα injection.
Notes: Western blot analysis shows that PKCα decreased compared to those from the dispase-injected and control groups (ANOVA, *P = 0.00220 < 0.01, **P = 0.00490 < 0.01). The β-actin band with 42 kDa is used for quantitation.
Abbreviations: PKCα, protein kinase C-alpha; siRNA-PKCα, small interference RNA-protein kinase C-alpha; ANOVA, analysis of variance.
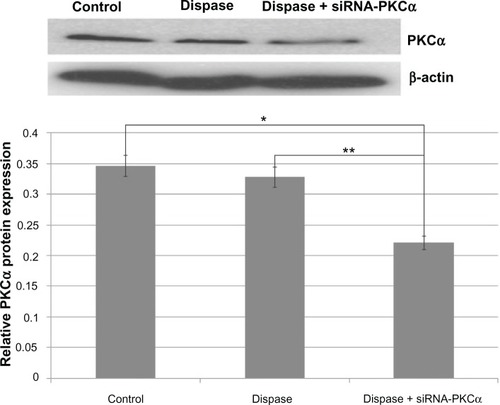
Figure 5 HE staining of eyes at 4 weeks after siRNA-PKCα injection.
Notes: A proliferative membrane and retinal detachment in the vitreous cavity were observed in the negative control, 250 nM, 500 nM, and 750 nM groups; however, normal retinal structures were found in the 1000 nM and 1500 nM groups when compared with normal eyes. Scale bar: 100 μm.
Abbreviations: HE, hematoxylin and eosin; siRNA-PKCα, small interference RNA-protein kinase C-alpha.
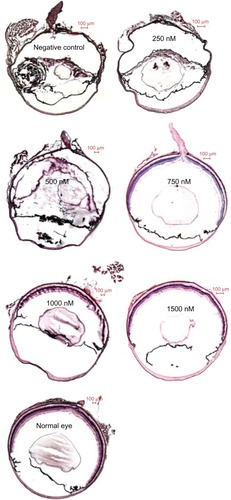
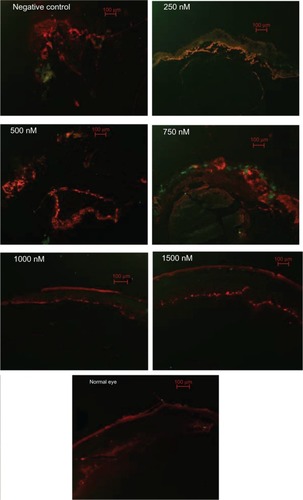
Figure 6 Immunofluorescence analysis of RPE65 and GS 4 weeks after siRNA-PKCα injection.
Notes: There are faint expressions of RPE65 (red) and GS (green) in normal retinas; these expressions seemed most pronounced in the epiretinal membranes in the negative control, as well as in the 250 nM, 500 nM, and 750 nM groups when compared to the 1000 and 1500 nM groups. Scale bar: 100 μm.
Abbreviations: RPE, retinal pigment epithelium; GS, glutamine synthetase.
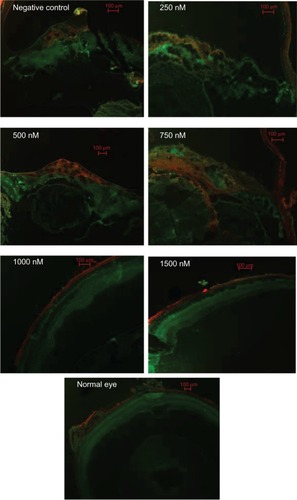
Figure 7 Immunofluorescence analysis of GFAP and α-SMA at 4 weeks after siRNA-PKCα injection.
Notes: There are faint expressions of GFAP (red) and (green) in normal retinas; these expressions seemed more pronounced in the epiretinal membranes in the negative control, as well as in the 250 nM, 500 nM, and 750 nM groups than in the 1000 nM and 1500 nM groups. Scale bar: 100 μm.
Abbreviations: GFAP, glial fibrillary acidic protein; α-SMA, α-smooth muscle antibody; siRNA-PKCα, small interference RNA-protein kinase C-alpha.