Figures & data
Table 1 PCR primers used in the study
Figure 1 Synthesis of MS2 VLPs containing pre-miR146a. The coding sequence of pre-miR146a, mutated pre-miR146a, and that of bacteriophage MS2 capsid protein were constructed into the recombinant plasmid. These MS2 VLPs were expressed in Escherichia coli, purified by density gradient centrifugation, and conjugated to the HIV protein transduction domain (Tat47–57 peptide) by sulfosuccinimidyl 4-[p-maleimidophenyl] butyrate (Sulfo-SMPB). (A) Identification of MS2-miR146a VLPs (left) and MS2-miRNC VLPs (right) by transmission electron microscopy (97,000×) before the conjugation reaction. (B) The Tat-MS2-miR146a VLPs were extracted and amplified by RT-PCR. Lane M: DL500 DNA marker; Lane 1: RNA derived from MS2-miR146a VLPs; Lane 2: negative control; Lane 3: positive control (PCR amplification of pre-miR146a cDNA from the recombinant plasmid). (C) The Tat-conjugated MS2-miR146a and Tat-conjugated MS2-miRNC VLPs were analyzed by SDS/PAGE. The Tat-MS2 VLPs exhibited slower mobility (~15 kDa, marked by the arrow) compared with the unmodified MS2 VLPs (~14 kDa). The extent of modification was evaluated through the density of SDS PAGE using the Quantity One imaging system. Lane M, molecular weight marker; Lane 1, Tat-MS2-miR146a VLPs; Lane 2, Tat-MS2-miRNC VLPs; Lane 3, unmodified MS2-miR146a VLPs.
Abbreviations: bp, base pair, VLPs, virus like particles.
![Figure 1 Synthesis of MS2 VLPs containing pre-miR146a. The coding sequence of pre-miR146a, mutated pre-miR146a, and that of bacteriophage MS2 capsid protein were constructed into the recombinant plasmid. These MS2 VLPs were expressed in Escherichia coli, purified by density gradient centrifugation, and conjugated to the HIV protein transduction domain (Tat47–57 peptide) by sulfosuccinimidyl 4-[p-maleimidophenyl] butyrate (Sulfo-SMPB). (A) Identification of MS2-miR146a VLPs (left) and MS2-miRNC VLPs (right) by transmission electron microscopy (97,000×) before the conjugation reaction. (B) The Tat-MS2-miR146a VLPs were extracted and amplified by RT-PCR. Lane M: DL500 DNA marker; Lane 1: RNA derived from MS2-miR146a VLPs; Lane 2: negative control; Lane 3: positive control (PCR amplification of pre-miR146a cDNA from the recombinant plasmid). (C) The Tat-conjugated MS2-miR146a and Tat-conjugated MS2-miRNC VLPs were analyzed by SDS/PAGE. The Tat-MS2 VLPs exhibited slower mobility (~15 kDa, marked by the arrow) compared with the unmodified MS2 VLPs (~14 kDa). The extent of modification was evaluated through the density of SDS PAGE using the Quantity One imaging system. Lane M, molecular weight marker; Lane 1, Tat-MS2-miR146a VLPs; Lane 2, Tat-MS2-miRNC VLPs; Lane 3, unmodified MS2-miR146a VLPs.Abbreviations: bp, base pair, VLPs, virus like particles.](/cms/asset/cb47b775-05b5-4bb1-bf1d-fb610495146f/dijn_a_37990_f0001_c.jpg)
Figure 2 The miR-146a expression in BXSB and C57BL/6 mice. (A) Total RNA was extracted from PBMCs, liver, lung, spleen, and kidney tissue of BXSB mice (n = 5 per group) at 12, 16 and 20 weeks of age (equating to a mild, moderate, or severe disease state, respectively) and control C57BL/6 mice (n = 5 per group) at 20 weeks of age. The miRNA expression profile was determined by qRT-PCR assay, normalized by U6 RNA, and then compared with that of C57BL/6 mice. *P < 0.05 and **P < 0.01, respectively, with regard to comparisons between the miR-146a expression levels of BXSB mice at different ages. •P < 0.05; ••P < 0.01 and •••P < 0.001, respectively, with regard to comparisons between the miR-146a expression levels in BXSB mice and age-matched C57BL/6 mice. (B) After administration of MS2-miR146a VLP over 12 days (at approximately 18 weeks of age, n = 5 per group), miR-146a levels in PBMCs, liver, lung, spleen, and kidney tissue were measured by qRT-PCR as described above.
Notes: “*,” “**,” and “***” indicate P < 0.05, P < 0.01 and P < 0.001, respectively.
Abbreviations: PBMC, peripheral blood mononuclear cell, VLPs, virus like particles.
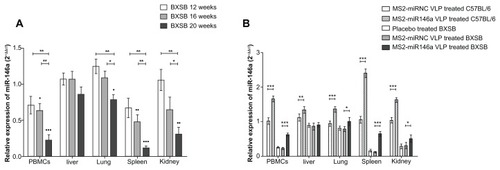
Figure 3 Decreased autoantibody production after MS2-miR146a VLP administration. (A) Anti-dsDNA and ANA levels in MS2-miR146a VLP-treated BXSB mice and their respective control mice (approximately 18 weeks of age, n = 5 per group) were evaluated by ELISA. (B and C) Immunofluorescence assay was used to verify the reduced expression of ANA in samples from MS2-miR146a VLP-treated BXSB mice (diluted 200-fold). Representative photomicrographs of ANA fluorescence in treated and respective control groups are shown. Fluorescence patterns were detected by fluorescence microscopy at 400× magnification. The fluorescence intensity of ANA in samples from placebo-treated BXSB mice was designated as 100%. (D) Total IgG and total IgM concentrations in MS2-miR146a VLP-treated BXSB mice and their respective control mice (approximately 18 weeks of age, n = 5 per group) were analyzed by ELISA.
Notes: *P < 0.05 and **P < 0.01, respectively.
Abbreviations: ANA, autoantibody to Nuclear Antigen, ELISA, enzyme-linked immunosorbent assay, VLPs, virus like particles.
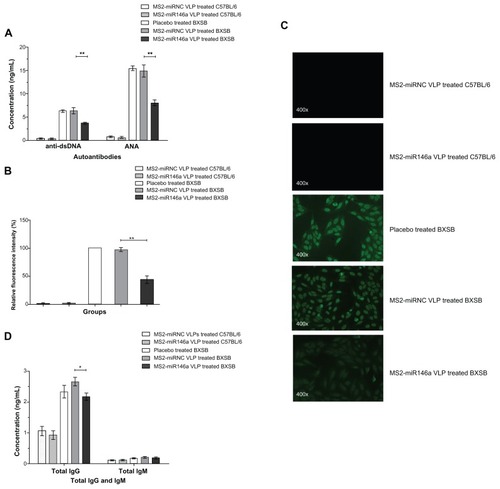
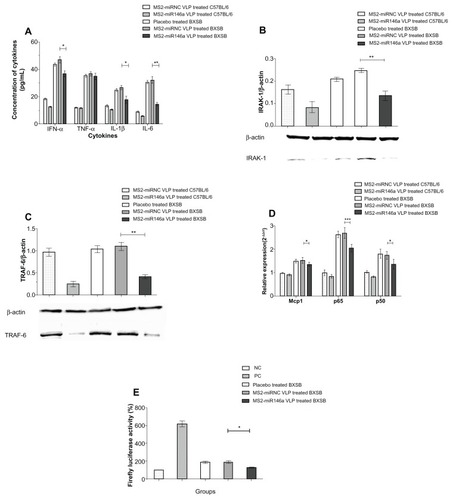
Figure 4 MS2-miR146a VLPs inhibit plasma cytokine production and impair the activation of NF-κB. (A) Plasma levels of IFN-α, TNF-α, IL-1β, and IL-6 were measured by competitive ELISA assay. (B and C) After administration of MS2-miR146a or control VLPs over 12 days (approximately 18 weeks of age, n = 5 per group), the expression of IRAK-1 and TRAF-6 in PBMCs was analyzed by Western blot. The relative concentration was normalized against that of β-actin. Photomicrographs are representative of results obtained from each group. (D) Total RNA was isolated from PBMCs and the mRNA transcript levels of NF-κB-responsive genes (Mcp1, NF-κB p65, and NF-κB p50) were determined by qRT-PCR using U6 RNA as an internal control. (E) NF-κB activity analysis using a luciferase assay. Luciferase activity was defined as the ratio of the reporter firefly luciferase activity to the control Renilla luciferase activity. The value obtained from PBMCs of PBS-treated C57BL/6 mice was designated as 100%.
Notes: *P < 0.05; **P < 0.01 and ***P < 0.001, respectively.
Abbreviations: ELISA, enzyme-linked immunosorbent assay; IFN-α, Interferon-α; Il-1β, Interleukin-1β; Il-6, Interleukin-6; IRAK-1, Il-1 receptor-associated kinase; Mcp1, monocyte chemotactic protein 1; NF-κB, nuclear factor-κB; PBMCs, peripheral blood mononuclear cell; TNF-α, tumor necrosis factor-α; TRAF-6, TNF receptor-associated factor-6; VLPs, virus like particles; NC, Negative control; PC, positive control.