Figures & data
Figure 1 Bar graph illustrating the different cytotoxicity of Fe@Au nanoparticles in CRC and OECM1 cells, as assessed with the WST-1 assay.
Notes: The CRC cell lines Caco-2, HT-29, and SW480 are directly compared with the OECM1 oral cancer cell line. From this graph, it becomes clear that CRC cells are less sensitive to Fe@Au treatment (Caco-2 cells, P = 0.0253; HT-29, P = 0.0376; SW480, P = 0.0601; t-test), compared to OECM1 cells.
Abbreviations: CRC, colorectal cancer; Fe, iron; Au, gold; WST-1, water-soluble tetrazolium salt.
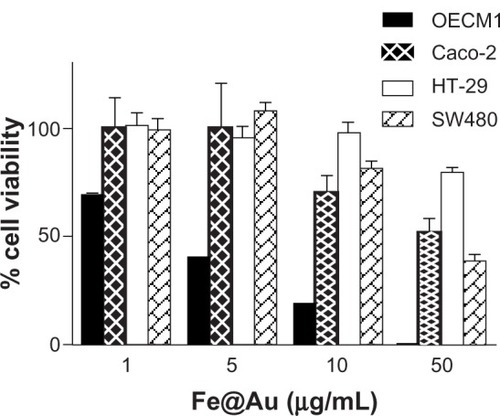
Figure 2 The bright-field optical images show the morphology of Fe@Au-treated cells.
Notes: Except for a different cell density, the CRC and OECM1 cells show no significant alteration in overall morphology after 24 hours of Fe@Au exposure. All images were recorded at the same magnification. Scale bar, 100 μm.
Abbreviations: CRC, colorectal cancer; Fe, iron; Au, gold.
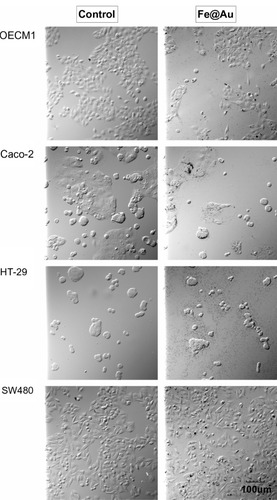
Figure 3 Fe@Au-treated cells visualized under intermediate- and high-magnification scanning electron microscopy.
Notes: At both magnifications, no significant fine-structure differences could be observed in the different cancer cells when treated with Fe@Au for 24 hours; ie, all cells remained well attached to the substratum and maintained their typical surface morphology, such as microvilli and numerous lamellipodia, corresponding to control conditions (data not shown). Insets illustrate the presence of discrete Fe@Au clumps (white arrows) on the surface of the cells. Scale bars inset, 1 μm.
Abbreviations: Fe, iron; Au, gold.
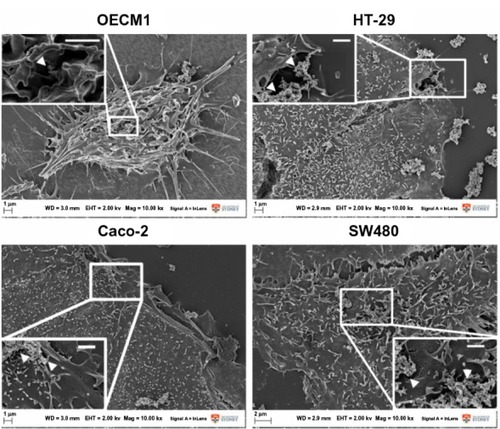
Figure 4 The apoptosis and necrosis of Fe@Au-treated cells were analyzed by flow cytometry.
Notes: The treated CRC cells show only a small increase in the number of apoptotic and necrotic cells. 10 μg/ml Fe@Au was used in OECM1; 50 μg/mL Fe@Au was used in CRC. Cells were treated for 24 hours.
Abbreviations: CRC, colorectal cancer; Fe, iron; Au, gold.
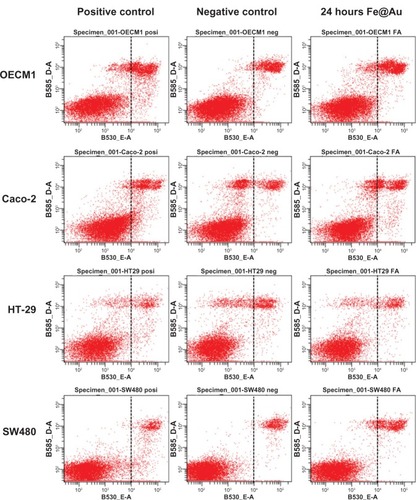
Figure 5 The cell cycle of Fe@Au treated cells analyzed via flow cytometry.
Notes: When compared to the S-phase delay of OECM1 cells, Fe@Au-treated CRC cells show a sharper peak at the left after 24 hours of treatment, indicating cell-cycle retardation at the G1/G0 phase.
Abbreviations: CRC, colorectal cancer; Fe, iron; Au, gold.
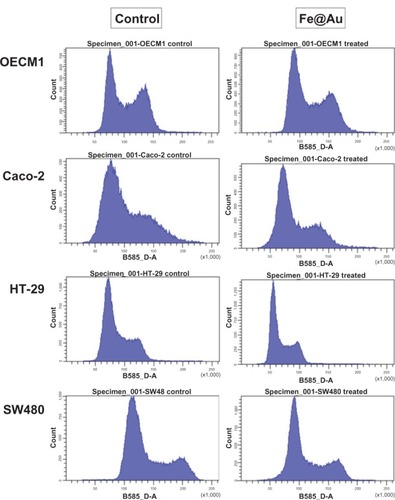
Figure 6 The mitochondrial response examined before and after Fe@Au treatment.
Notes: Among the CRC cell lines investigated, only Caco-2 cells show a minor increase in mitochondrial membrane potential after 24 hours of treatment. ‘4 hours Fe@Au’ indicates a 50 μg/mL Fe@Au treatment for 4 hours, and ‘24 hours Fe@Au’ indicates a 50 μg/mL Fe@Au treatment for 24 hours.
Abbreviations: Fe, iron; Au, gold; CRC, colorectal cancer.
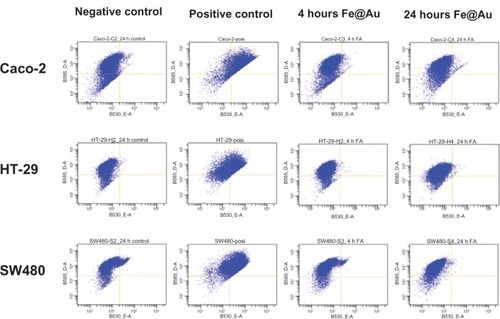
Figure 7 Bar graph illustrating the overall viability of Fe@Au-treated cancer cells, and the influence of the mitochondrial membrane potential blocker CsA and the autophagy inhibitor 3-MA.
Notes: WST-1 cell viability analysis was performed after 48 hours with the assigned treatment; ie, either in the presence with 5 μM CsA or 10 mM 3-MA. The cell viability of Fe@Au + CsA and Fe@Au + 3-MA was calculated according to the matching control conditions of CsA alone and 3-MA alone. *P & 0.05; **P & 0.01; t-test.
Abbreviations: Fe, iron; Au, gold; CsA, cyclosporin A; 3-MA, 3-methyladenine; WST-1, water-soluble tetrazolium salt.
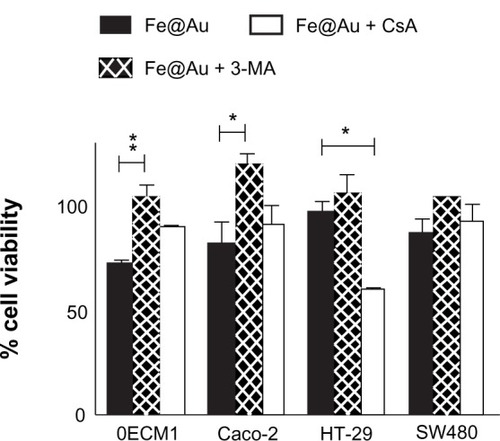
Figure 8 Line graph summarizes the internalization profiles of Fe@Au nanoparticles as assessed by ICP-OES.
Notes: Cells were treated with 50 μg/mL of Fe@Au for the assigned times; the cells were harvested; and the Fe and Au concentration was analyzed. From this graph, it becomes clear that the total amount of internalized Fe or Au is not proportional to the cytotoxicity observed in individual cells.
Abbreviations: ICP-OES, inductively coupled plasma optical emission spectrometry; Fe, iron; Au, gold.
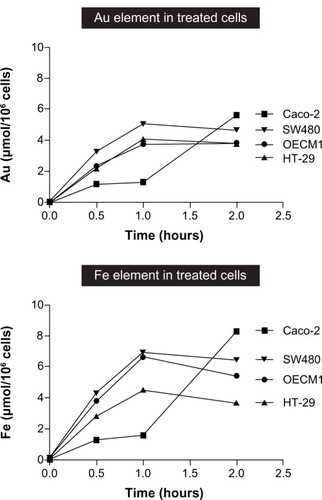
Figure 9 The ratio of internalized Fe and Au elements was explored at different times.
Notes: The molar ratio of Fe to Au is used as an index of internalized elements. In the early time points (30 minutes and 1 hour), the OECM1 cells show the highest Fe:Au ratio. Interestingly, the Fe:Au ratio in HT-29 cells is significantly lower than in OECM1 cells (P = 0.0210; t-test), which correlates with HT-29 cells’ extreme resistance to Fe@Au treatment ().
Abbreviations: Fe, iron; Au, gold.
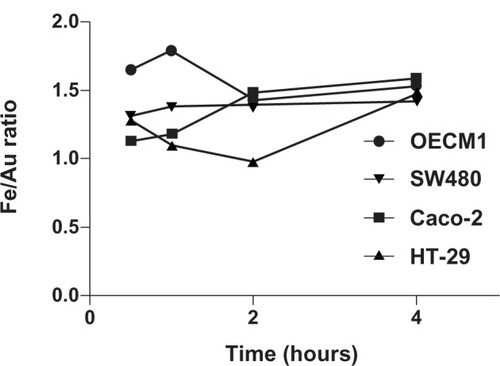
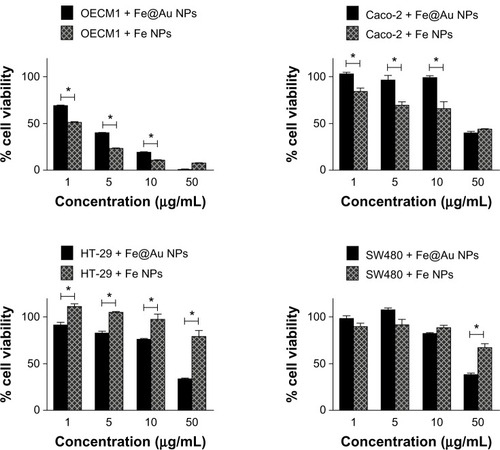
Figure 10 Cytotoxic response of different cell lines shows different sensitivity toward Fe@Au or Fe-only nanoparticle treatments.
Notes: CRC and OECM1 were treated with Fe-only nanoparticles (Fe NPs) and Fe@Au nanoparticles (Fe@Au NPs) for 48 hours, analyzed by WST-1. OECM1 and Caco-2 are more sensitive to Fe nanoparticles; whereas, the other CRC, (HT-29 and SW480) are more resistant to Fe nanoparticles than to Fe@Au nanoparticles. (*P & 0.05; t-test).
Abbreviations: Fe, iron; Au, gold; NPs, nanoparticles; WST-1, water-soluble tetrazolium salt; CRC, colorectal cancer.