Figures & data
Table 1 The effect of different sets of nanoparticles according to the air pouch test
Figure 1 Optimization of the air pouch model.
Notes: (A) schematic outline of the air pouch model. At the start of the test, 3 mL air is injected through a sterile 0.20 μm filter at a dermal site of a mouse to form a pouch. On the third day, this action is repeated. Products are injected on day 6 after the start and their cellular and molecular effects are measured 24 hours later by retrieval of cells and molecules within the pouch exudates. (B–D) COAM induces a dose-dependent recruitment of neutrophils and can be used as a standard for the air pouch model. The air pouch model was executed in the standard setting of 6 day formation and 24 hour contact time for test samples. COAM was used at different doses. Three possible read-outs are shown: (B) Increase (and saturation) of percentage neutrophils, (C) decrease of macrophage percentages and (D) decrease of percentage lymphocytes (n=5 for all test samples). The positive control reached saturation at 1 mg COAM per pouch. (E) Analysis of the absolute numbers of retrieved cells per pouch. (F and G) correlation between FACS and cytospin data from mouse air pouches. (F) Correlation (two-tailed parametric correlation analysis) between percentages of neutrophils (polymorphonuclear cells) as measured by FACS analysis and cytospin analysis (r=0.80, n=45). Linear regression was performed and found to be significant (P<0.0001). (G) Correlation (two-tailed parametric correlation analysis) of percentages mononuclear cells as measured by FACS analysis and cytospin analysis (r=0.58, n=79). Linear regression was performed and found to be significant (P<0.0001).
Abbreviations: COAM, chlorite-oxidized oxyamylose; FACS, fluorescence-activated cell sorting; PBS, phosphate-buffered saline.
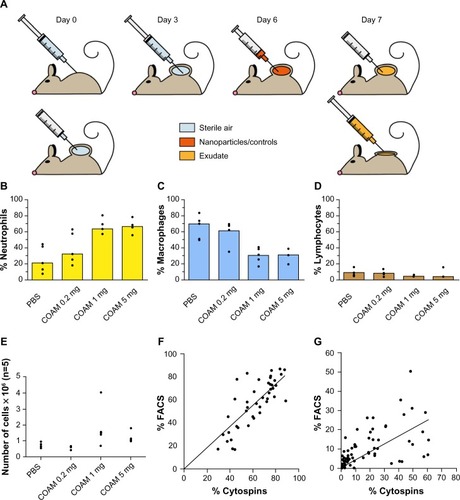
Figure 2 Analysis of polystyrene particles with different sizes in air pouches.
Notes: Particles were either endotoxin-free polystyrene nanoparticles (100 nm) or polystyrene microspheres with a diameter of 1 μm. (A) Analysis of the absolute numbers of retrieved cells. (B) The relative numbers of leukocytes as determined by hemocytometry and as corroborated by FACS analysis. (C) Illustration of cytospin preparations stained with hemacolor and higher magnifications of the cells in the insets. (D) Illustration of gelatin zymography analysis of air pouch fluids. Gelatinase A/matrix metalloproteinase-2 (MMP-2) is constitutively expressed in all samples and gelatinase B/MMP-9 is up regulated after injection of COAM or polystyrene nanoparticles. (E) Scanning densitometry analysis of gelatin zymograms. The MMP-9 content is expressed as the ratios of MMP-9 versus constitutive MMP-2. The results illustrate the acute inflammatory context of air pouches, after COAM treatment, at the molecular level. Clearly, cellular infiltration is correlated with the induction of MMP-9.
Abbreviations: COAM, chlorite-oxidized oxyamylose; FACS, fluorescence-activated cell sorting; MMP, matrix metalloproteinase; PBS, phosphate-buffered saline.
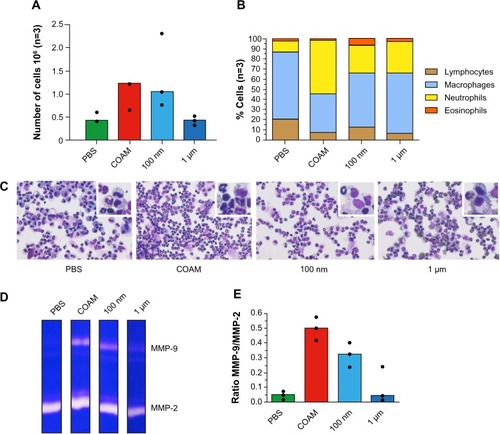
Figure S1 CAN-γ-Fe2O3, type I PEI25-CAN-γ-Fe2O3 and type II PEI25-CAN-γ-Fe2O3 NPs TEM and size distribution.
Notes: (A) CAN-γ-Fe2O3 NPs (left) TEM microphotograph; (right) size distribution histogram of 7.61±2.33 nm-sized CAN-γ-Fe2O3 NPs. (B) Type I PEI25-CAN-γ-Fe2O3 NPs (left) TEM microphotographs; (right) size distribution histogram of averaged 6.50±2.15 nm-sized Type I PEI25-CAN-γ-Fe2O3 NPs. (C) Type II PEI8-CAN-γ-Fe2O3 NPs (left) TEM microphotographs; (right) size distribution histogram of averaged 7.65±2.64 nm-sized Type II PEI25-CAN-γ-Fe2O3 NPs.
Abbreviations: NP, nanoparticle; PEI, polyethylene imine; TEM, transmission electron microscopy.
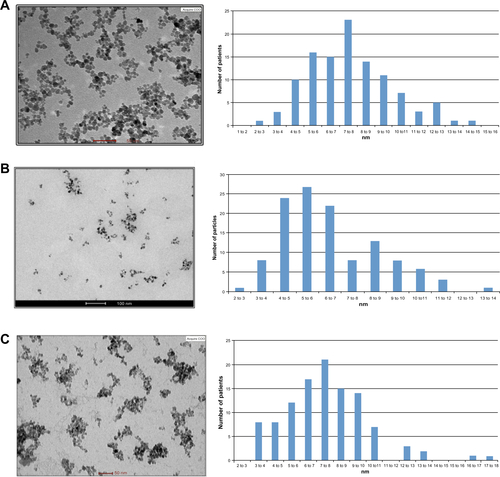
Figure S2 PDMAEMA and PMAAc SCPNs dynamic light scattering (DLS) and atomic force microscopy (AFM) images.
Notes: (A) PDMAEMA SCPNs (left) DLS measurement data: average size of 13±2.9 nm, and (right) AFM picture of dry nanoparticles around 3 nm in size; (B) PMAAc SCPNs (left) DLS measurement data: average size of 16±4.2 nm; and (right) AFM picture of dry nanoparticles around 5 nm in size.
Abbreviations: PDMAEMA, poly(N,N-dimethylaminoethyl methacrylate); PMAAc, polymethacrylic acid; SCPN, single-chain polymeric nanoparticle.
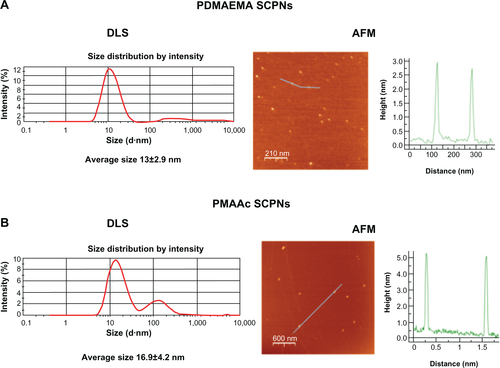
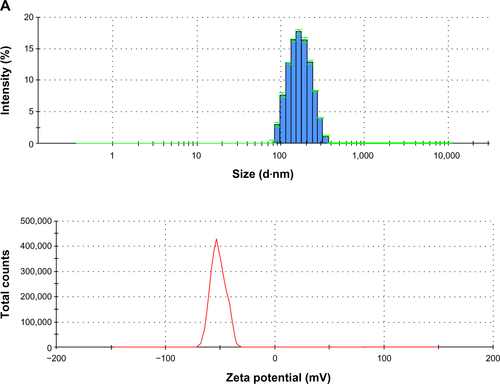
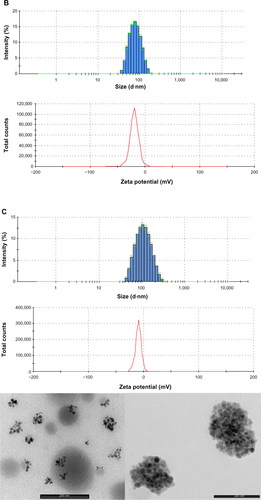
Figure S3 PLGA-COOH NPs, PLGA-b-PEG-COOH NPs and Magh@PNPs size distribution histograms, zeta potentials and transmission electron microscopy images.
Notes: (A) PLGA-COOH NPs (top) size distribution histogram; (bottom) ζ potential of PLGA-COOH NPs; (B) PLGA-b-PEG-COOH NPs (top) size distribution histogram; (bottom) ζ potential of PLGA-b-PEG-COOH NPs; (C) Magh@PNPs (top) size distribution histogram, (middle) ζ potential, and (bottom) TEM microphotographs of Magh@PNPs.
Abbreviations: NP, nanoparticle; PEG, polyethylene glycol; PLGA, poly(D,L-lactide-co-glycolide); PNPs, polymeric nanoparticles; TEM, transmission electron microscopy.