Figures & data
Figure 1 Thrombotic occlusion time in pial venules 24 hours after the administration of either 50 nm or 500 nm amorphous silica nanoparticles (0.5 mg/kg) in mice.
Notes: *P<0.01 compared with the corresponding saline-treated group. Data are mean ± standard error of mean (n=8).
Abbreviations: s, seconds; SiNP, silica nanoparticle.
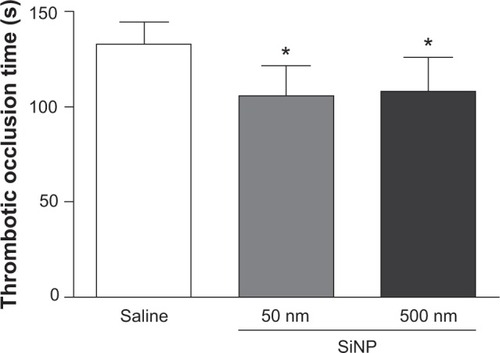
Figure 2 Results 24 hours after the administration of either 50 nm or 500 nm amorphous silica nanoparticles (0.5 mg/kg) in mice.
Notes: Platelet numbers (A) and plasminogen activator inhibitor-1 (B), fibrinogen (C), and von Willebrand factor (D) concentrations in plasma, 24 hours after the administration of either 50 nm or 500 nm amorphous silica nanoparticles (0.5 mg/kg) in mice. *P<0.05, **P<0.005, and ***P<0.0001 compared with the corresponding saline-treated group. ΔP<0.05 and ΔΔP<0.0001 compared with the 500 nm silica nanoparticle-treated group. Data are mean ± standard error of mean (n=6–8).
Abbreviations: SiNP, silica nanoparticle; PAI-1, plasminogen activator inhibitor-1; vWF, von Willebrand factor.
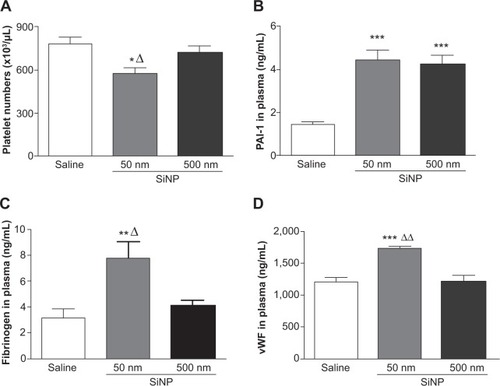
Figure 3 Direct in vitro effect after the administration of either 50 nm or 500 nm amorphous silica nanoparticles (SiNPs) on platelet aggregation in whole blood of untreated mice.
Notes: Platelet aggregation in untreated whole blood 3 minutes after the addition of either saline or 50 nm or 500 nm SiNPs (0.2–5 μg/mL) was assessed. The degree of platelet aggregation following SiNP exposure was expressed in percent of control (saline-treated blood). Data are mean ± standard error of mean (n=5–6). *P<0.05 and **P<0.001 compared with saline-treated blood within the same group. ΔP<0.001 between 50 nm and 500 nm groups for the same given SiNP concentration.
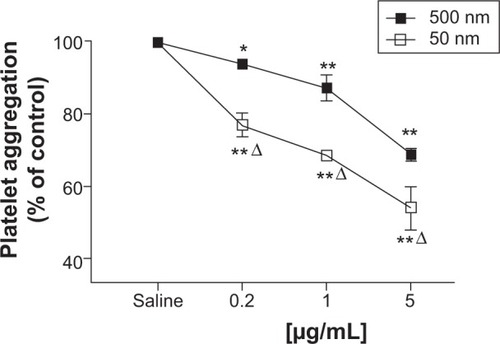
Figure 4 Lactate dehydrogenase activity in plasma 24 hours after the administration of either 50 nm or 500 nm amorphous silica nanoparticles (0.5 mg/kg) in mice.
Notes: *P<0.05 compared with the corresponding saline-treated group. Data are mean ± standard error of mean (n=6–7).
Abbreviations: LDH, lactate dehydrogenase; SiNP, silica nanoparticle.
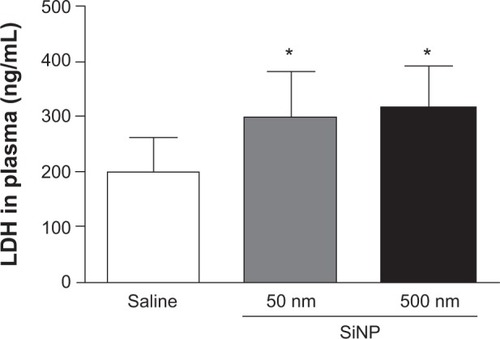
Figure 5 Effect of amorphous silica nanoparticles on plasma concentrations of proinflammatory cytokines.
Notes: Tumor necrosis factor α (A) and interleukin 1β (B) in plasma, 24 hours after the administration of either 50 nm or 500 nm amorphous silica nanoparticles (0.5 mg/kg) in mice. *P<0.05 and **P<0.001 compared with the corresponding saline-treated group. ΔP<0.05 and ΔΔP<0.0001 between 50 nm and 500 nm silica nanoparticle-treated groups. Data are mean ± standard error of mean (n=6–8).
Abbreviations: TNFα, tumor necrosis factor α; SiNP, silica nanoparticle; IL-1β, interleukin 1β.
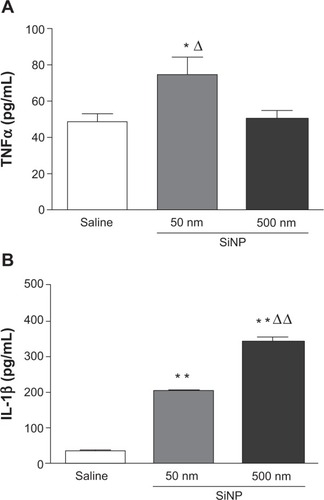
Figure 6 Effect of amorphous silica nanoparticles markers of oxidative stress in plasma.
Notes: 8-isoprostane (A) thiobarbituric acid reactive substances (B) catalase (C) and glutathione S-transferase (D) levels in plasma, 24 hours after the administration of either 50 nm or 500 nm amorphous silica nanoparticles (0.5 mg/kg) in mice. Data are mean ± standard error of mean (n=7–8).
Abbreviations: SiNP, silica nanoparticles; TBARS, thiobarbituric acid reactive substances; GST, glutathione S-transferase; min, minute.
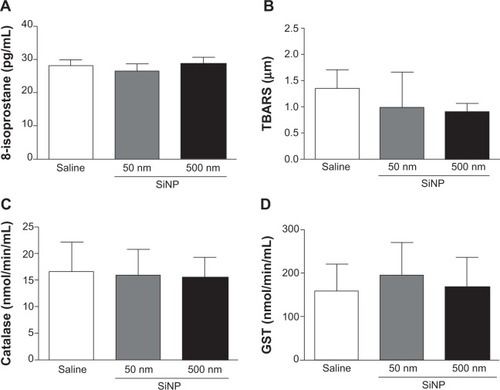
Figure 7 Inhibition of cellular viability by amorphous silica nanoparticles.
Notes: Inhibition of cellular viability by 50 nm (A) and 500 nm (B) amorphous silica nanoparticles. Exponentially growing human umbilical vein endothelial cells were treated with either saline or various concentrations (0.1–100 μg/mL) of 50 nm or 500 nm silica nanoparticles. Viable cells were assayed as described in materials and methods. All experiments were repeated three times. Data are mean ± standard error of mean. *P<0.001 compared with the corresponding control-treated group.
Abbreviations: HUVEC, human umbilical vein endothelial cells; SiNP, silica nanoparticle.
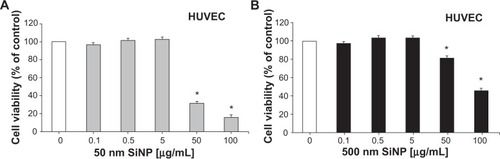
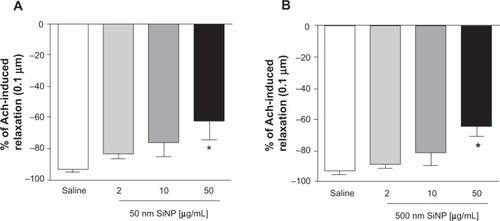
Figure 8 Relaxation of small mesenteric arteries of rats.
Notes: Relaxation of small mesenteric arteries of rats caused by 0.1 μm acetylcholine after incubation with either saline (control) or various concentrations (2–50 μg/mL) of either 50 nm (A) or 500 nm (B) amorphous silica nanoparticles. Data are mean ± standard error of mean of % change (n=4). *P<0.05 compared with the corresponding saline-treated group.
Abbreviations: Ach, acetylcholine; SiNP, silica nanoparticle.