Figures & data
Figure 1 Bone marrow-derived mesenchymal stem cells (BMSCs) encapsulated in self-assembled peptide (SAP) were injected directly into the articular cavity of osteoarthritis (OA) knee joints. SAP is characterized by the formation of networks of peptide β-sheet filaments. Scale bar 50 nm.
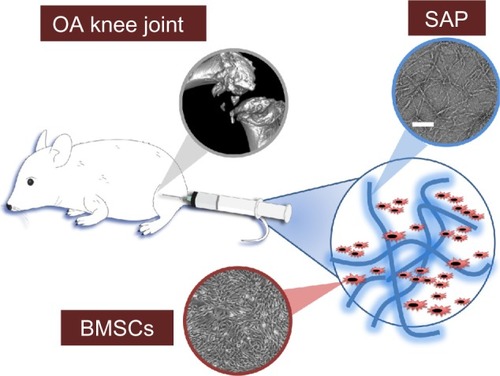
Figure 2 Disappearance rate of biotinylated self-assembled peptides (SAPs) was detected by DyLight 594-conjugated streptavidin staining. Biotinylated SAPs decreased over time but still remained at week 6. The concentration of biotinylated SAPs at week 1 (n=2) was not significantly different from those at week 3 (n=4) and week 6 (n=4). Scale bar 100 μm.
Abbreviation: DAPI, 4′,6-diamidino-2-phenylindole.
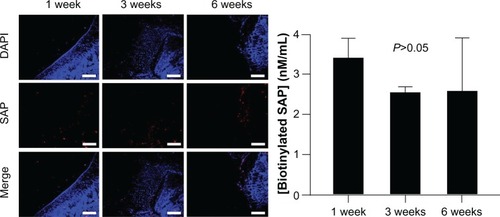
Table 1 Group distribution of osteoarthritic changes in micro-computed tomography
Figure 3 Casp-8 and TIMP-1 were detected by immunofluorescence staining. Diffuse positive staining for Casp-8 and TIMP-1 were found in the control group, whereas localized or minimal staining was observed in other groups. Scale bar 100 μm.
Abbreviations: Casp, caspase; TIMP, tissue inhibitor of metalloproteinases; DAPI, 4′,6-diamidino-2-phenylindole; MSC, mesenchymal stem cell; SAP, self-assembled peptide.
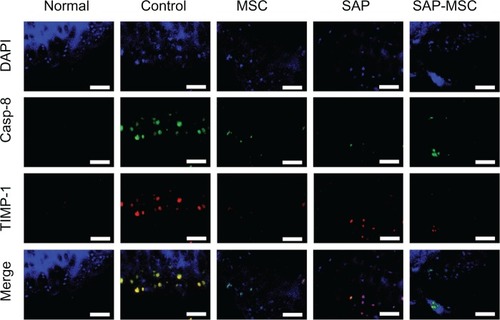
Figure 4 MMP-9 and Col II were detected by immunofluorescence staining. MMP-9 was diffusely stained in the control group, but not in the SAP and SAP-MSC groups. The Col II detected by immunofluorescence staining was less abundant in the control group compared to the normal and MSC groups. Scale bar 100 μm.
Abbreviations: MMP, matrix metalloproteinase; Col II, collagen type II; DAPI, 4′,6-diamidino-2-phenylindole; MSC, mesenchymal stem cell; SAP, self-assembled peptide.
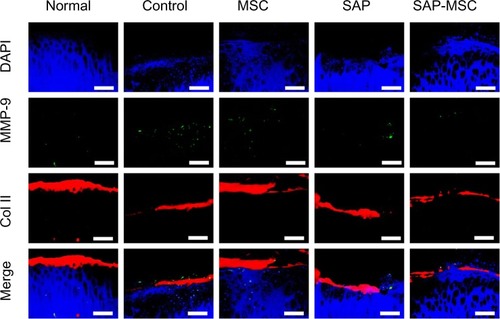
Figure 5 Apoptosis of chondrocytes in three rats from each group was detected by the DeadEnd Fluorometric TUNEL system. A significant difference of chondrocyte apoptosis between the control group and other groups was found (means ± standard error of mean). *P-value is less than 0.05.
Abbreviations: TUNEL, terminal deoxynucleotidyl transferase deoxyuridine triphosphate nick-end labeling; MSC, mesenchymal stem cell; SAP, self-assembled peptide.
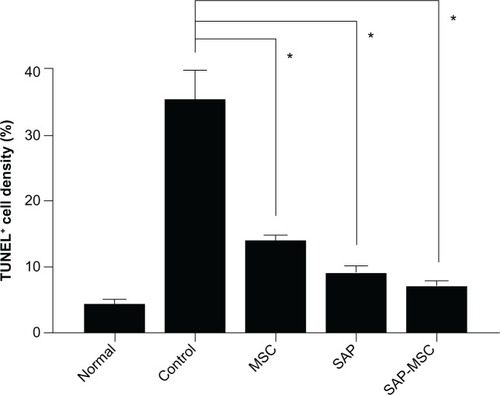
Figure 6 (A–D) Representative figures (magnification ratio 200×) are presented, and modified Mankin scores in the control (n=5), MSC (n=6), SAP (n=6), and SAP-MSC (n=6) groups are shown as means ± standard error of mean.
Notes: The scores in the SAP and SAP-MSC groups were significantly lower than that in the control group. From the left upper quadrant, figures show reduction in Alcian blue staining (A), destroyed cartilage structures (B), destroyed tidemark (C), and clusters of cartilage cells (D). Scale bar 50 μm. *P-value is less than 0.05.
Abbreviations: MSC, mesenchymal stem cell; SAP, self-assembled peptide.
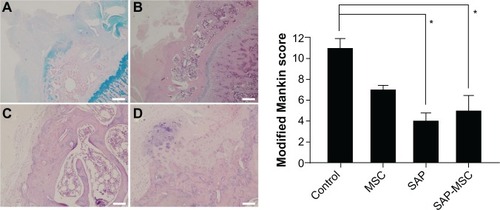
Figure 7 Representative figures (magnification ratio 200×) were presented for thickened synovial membrane infiltration of inflammatory cells in the control group (A) and reduced changes in the SAP-MSC group (B). Synovial inflammation scores in the control (n=5), MSC (n=6), SAP (n=6), and SAP-MSC (n=6) groups are shown as means ± standard error of mean.
Abbreviations: MSC, mesenchymal stem cell; SAP, self-assembled peptide.
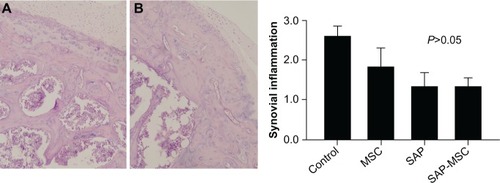
Figure 8 Behavioral results before, 3 weeks after, and 6 weeks after the injection were described in all groups (five rats in the control group and six rats in other groups). There was neither group nor time difference in the number of attempted rears (P=0.071 in time and P=0.321 in group) or maximum stride length (P=0.537 in time and P=0.188 in group).
Abbreviations: MSC, mesenchymal stem cell; SAP, self-assembled peptide.
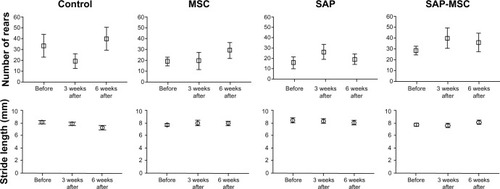
Figure S1 Intra-articular injection (0.2 mL) of SAP, MSC, and SAP-MSC was administered directly into the articular cavity. After palpating the patella with the knee bent, a 26-gauge needle was inserted about 5 mm above the upper margin of the patella. With verification of no soft-tissue swelling, each compound was injected directly into the articular cavity.
Abbreviations: MSC, mesenchymal stem cell; SAP, self-assembled peptide.
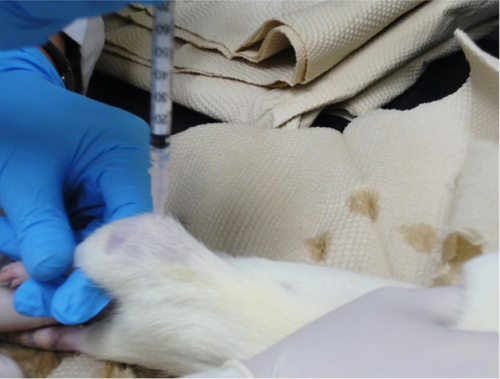
Figure S2 Synovial fluid extraction. Needles of two syringes were inserted into an articular cavity of killed animals. Phosphate-buffered saline was infused into the articular cavity and constantly withdrawn by the other syringe. The rate of infusion and withdrawal was manually but carefully controlled in order to prevent any leakage of synovial fluid into the surrounding soft tissue.
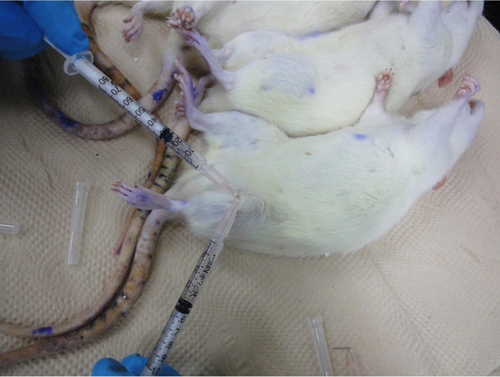
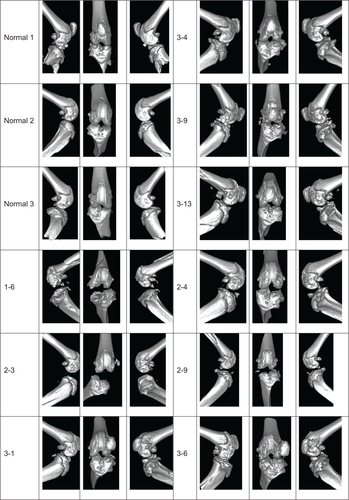
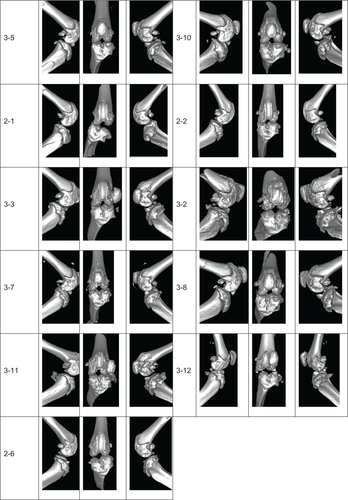
Figure S3 Osteoarthritis (OA) grade was rated using micro-computed tomography (CT). All grades were rated by a blinded subject.
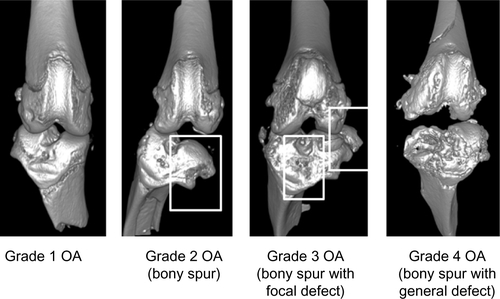
Figure S4 An open-field acrylic box with dimensions of 30 × 30 × 30 cm3 was placed in a room with minimum noise. The bottom consisted of several foam stamp pads. The rats got their paws covered in ink and left footprints on the paper when they stood on their hind limbs and touched the walls of the box with their forelimbs.
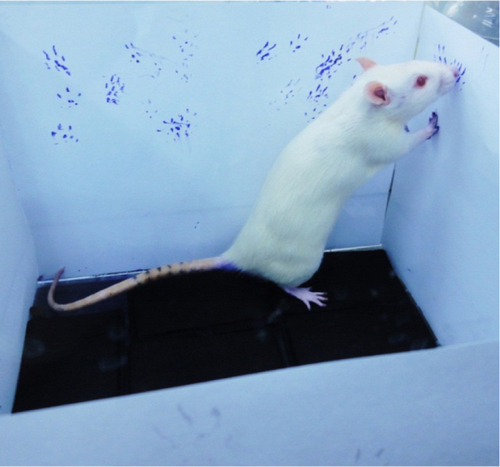
Figure S5 (A–D) Estimating the number of rears attempted with ImageJ software. (A) The papers containing rat footprints are scanned and saved as image files. (B) The saved image files were digitally smoothed by using the “Smooth” function under the “Process” menu in ImageJ. (C) The images were changed to 8-bit images by selecting “Type” and “8-bit” under the “Image” menu. The threshold level of the images was set to 230 for binary image acquisition by clicking “Adjust” and “Threshold” under the “Image” menu. (D) The number of distinct particles above 5 cm from the bottom of the image was counted by first making rectangular selections in the images and using “Analyze particles” under the “Analyze” menu. The number of rears was estimated by dividing the number of particles by 14.
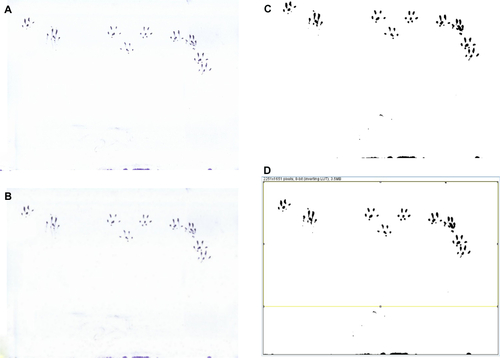
Figure S6 Sample footprints of rodents. Procedure the same as Hasler et al.Citation1

Figure S7 Micro-computed tomography images of rat knee joints. The Inveon system was used. The scanned images were exported and analyzed using Inveon Research Workplace. Regions of interests were drawn on trabecular bones for three-dimensional visualization.