Figures & data
Figure 1 Transmission electron micrographs on supportive film showing the morphology of silver nanoparticles used in the experiment and indicating variable dimensions. Scale bars 61.5 and 64.5 nm.
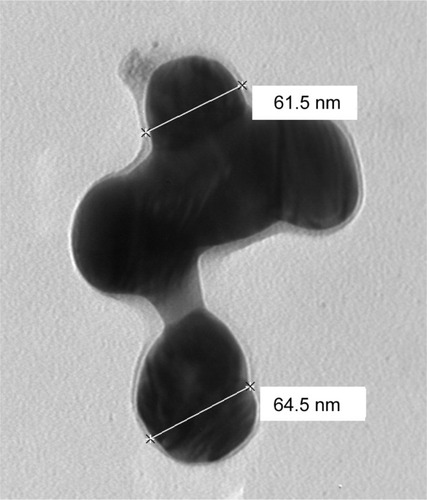
Figure 2 A to D transmission electron micrographs on supportive film showing the morphology of silver nanoparticles used in the experiment and indicating variable dimensions. Scale bars from 25.1–58.3 nm.
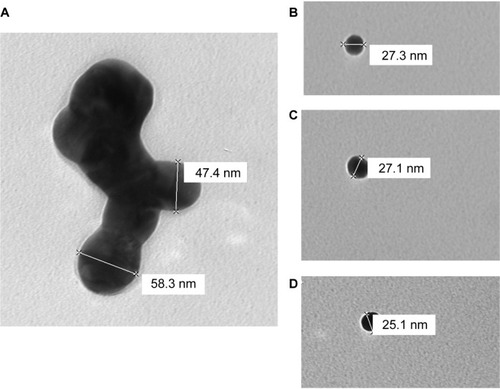
Figure 3 Semithin section of the kidney tubule tissue from the control group showing normal appearance of the tubular epithelium. Scale bar 50 μm.
Abbreviation: Te, tubular epithelium.
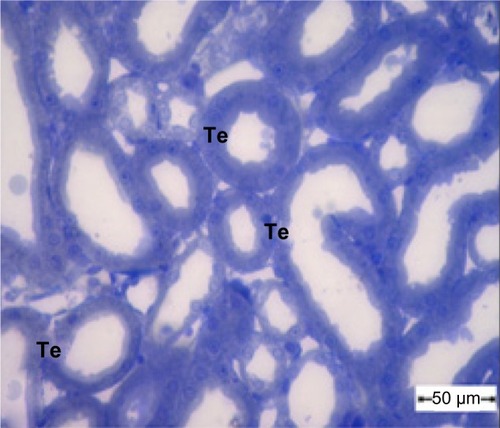
Figure 4 Semithin section of kidney tissue from the treatment group showing swollen tubular epithelium and cytoplasmic vacuolization. Note that the glomeruli show an increase in cellularity and obliteration of Bowman’s space. Scale bar 50 μm.
Abbreviations: Ag, silver nanoparticles; Bs, Bowman’s space; Cv, cytoplasmic vacuolization; Gl, glomeruli; Hn, hypertrophied nuclei; Te, tubular epithelium.
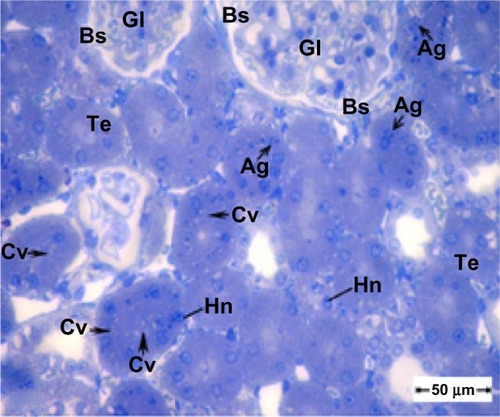
Figure 5 Transmission electron micrograph of kidney tubule tissue from the control group showing normal ultrastructure of the tubular epithelial cell layer in the basement membrane (arrow head). Note the nucleus, mitochondria, brush border, and membranous vesicles. Scale bar 2 μm.
Abbreviations: b, brush border; m, mitochondria; N, nucleus; v, membranous vesicles.
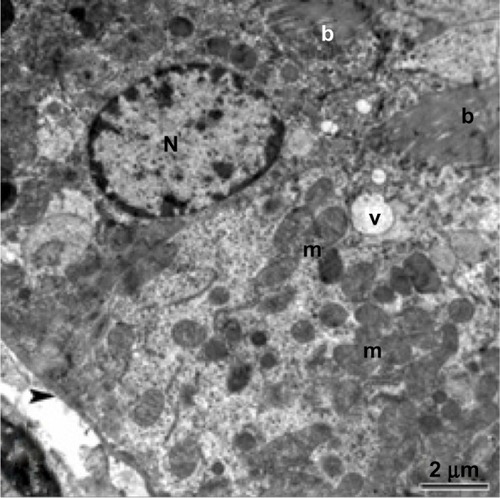
Figure 6 Transmission electron micrograph of kidney glomerular tissue from the control group showing a capillary tuft containing red blood cells, podocytes with primary (star) and secondary (arrows) processes, and mesangial cells. Scale bar 2 μm.
Abbreviations: C, capillary tuft; Ms, mesangial cells; P, podocytes; RBC, red blood cells.
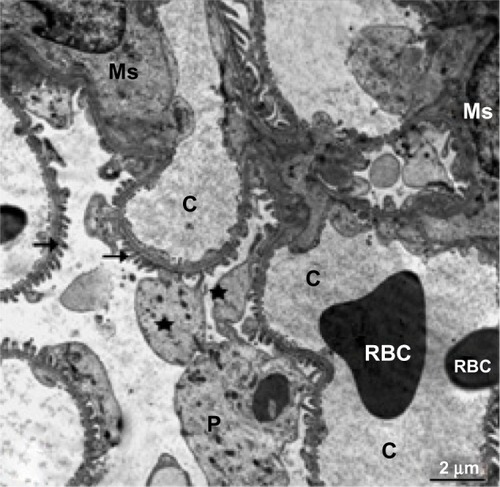
Figure 7 Transmission electron micrograph of kidney tubular epithelium from the treated group showing the nucleus, numerous vesicles, and mitochondria with cristae. The lysosomes are filled with electron-dense nanoparticles varying in size and shape (arrow). Note that the tubular epithelium is lying on a thickened basement membrane (arrow head) and its free surface has a long brush border. Scale bar 2 μm.
Abbreviations: b, brush border; Ly, lysosomes; m, mitochondria; N, nucleus; V, vesicles.
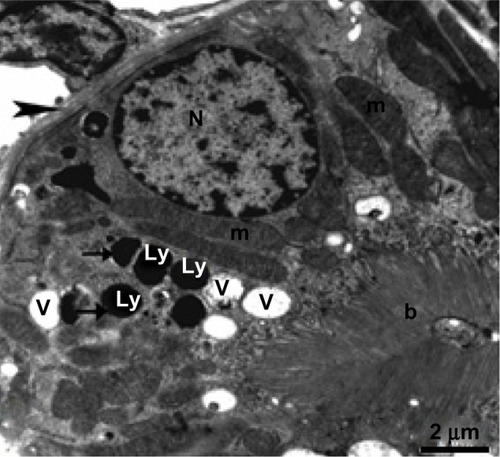
Figure 8 Higher magnification of the previous micrograph showing the nucleus, well developed mitochondria, and membranous vesicles, as well as lysosomes containing electron-dense nanoparticles (thick arrows). Note that some mitochondrial cristae are destroyed (thin arrows). Scale bar 2 μm.
Abbreviations: b, brush border; Ly, lysosomes; m, mitochondria; N, nucleus; Np, nanoparticles; V, membranous vesicles.
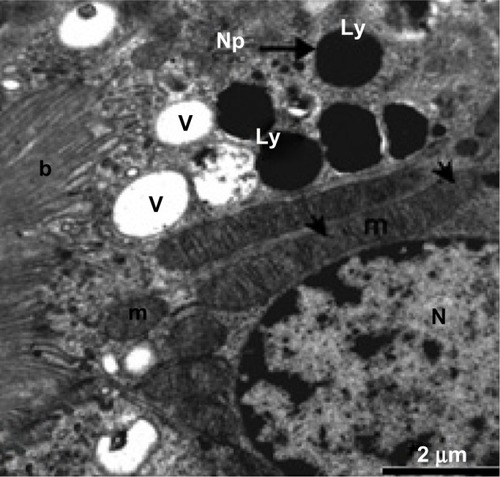
Figure 9 Transmission electron micrograph of kidney glomerular tissue from the treated group showing swollen podocytes with numerous long primary (stars) and secondary processes (arrows) rich in organelles, mitochondria, rough endoplasmic reticulum, and thickening of the basement membrane (arrowhead) in the capillary tuft. The body of an endothelial cell (en) can be seen. Scale bar 2 μm.
Abbreviations: C, capillary; en, endothelial cell; m, mitochondria; P, podocytes; RER, rough endoplasmic reticulum.
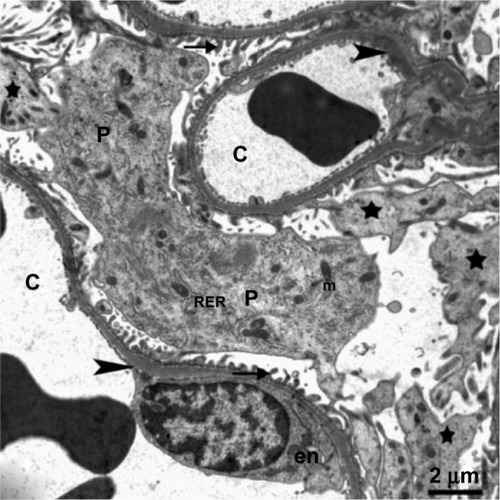
Figure 10 A semithin section of liver tissue from the control group showing the normal cytoarchitecture of the lobule.
Notes: The central vein is surrounded by hepatic cells separated by blood sinusoids. Scale bar 20 μm.
Abbreviations: Ce, central vein; H, hepatic cells; S, blood sinusoids.
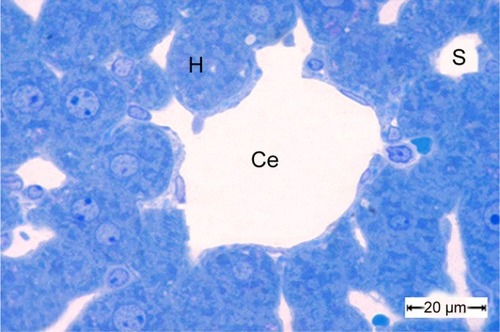
Figure 11 Semithin section of liver tissue from the treated group showing narrowing of the sinusoidal lumen. Scale bar 50 μm.
Abbreviations: H, hepatocytes; Hn, hypertrophied nuclei; Kc, Kupffer cells; s,sinusoidal lumen.
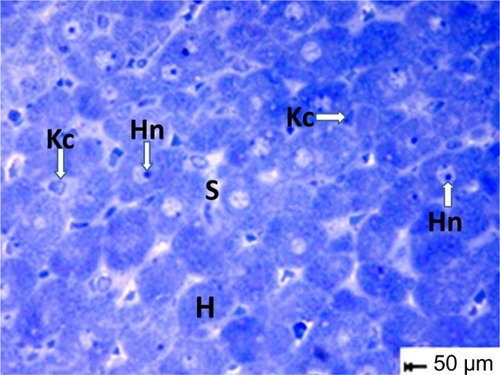
Figure 12 Semithin section of liver tissue from the treated group showing swollen hepatic cells with narrowing of the sinusoidal lumen and hypertrophied Kupffer cells. Scale bar 50 μm.
Abbreviations: H, hepatic cells; Hn, hypertrophied nuclei; Kc, Kupffer cells; s, sinusoidal lumen.
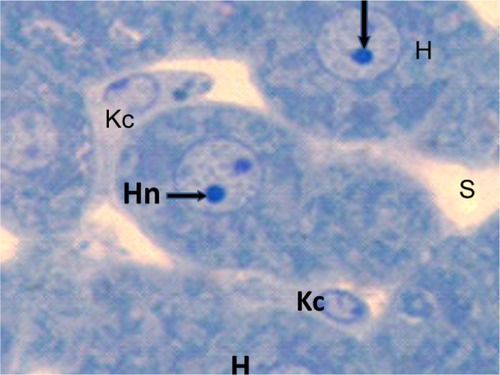
Figure 13 Transmission electron micrograph of a hepatic cell from the control group showing the normal ultrastructure of the hepatic cell, nucleus, mitochondria, rough endoplasmic reticulum, microbodies, and glycogen granules. Scale bar 2 μm.
Abbreviations: g, glycogen granules; H, hepatic cell; m, mitochondria; mb, microbodies; N, nucleus; RER, rough endoplasmic reticulum.
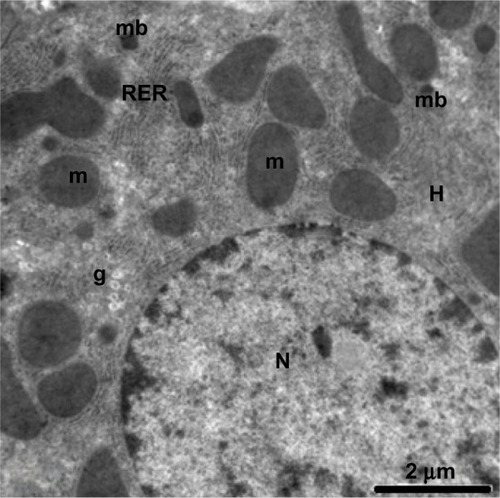
Figure 14 Magnified micrograph of a hepatic cell from the control group showing the normal ultrastructure of the nucleus and its nuclear membrane, containing nucleopores (arrows), well developed rough endoplasmic reticulum, well developed mitochondria, and glycogen granules. Scale bar 500 nm.
Abbreviations: g, glycogen granules; m, mitochondria; N, nucleus; RER, rough endoplasmic reticulum.
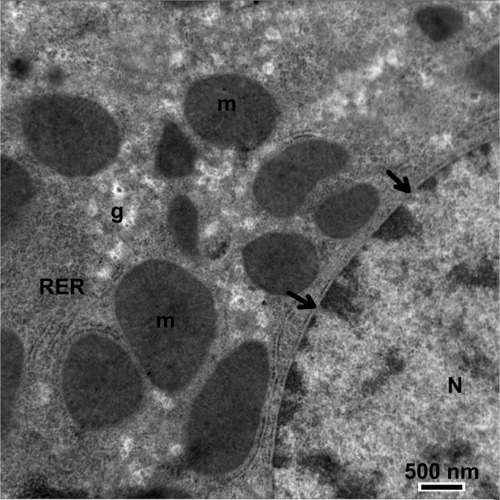
Figure 15 Transmission electron micrograph of a hepatic cell from the treated group containing numerous fat globules and a nucleus with hypertrophied nucleoli. Notice the presence of cytoplasmic vacuolization, the sinusoidal lumen, and Disse’s spaces. Scale bar 2 μm.
Abbreviations: Cv, cytoplasmic vacuolization; Ds, Disse’s spaces; f, fat globules; H, hepatic cell; N, nucleus; ne, nucleoli; S, sinusoidal lumen.
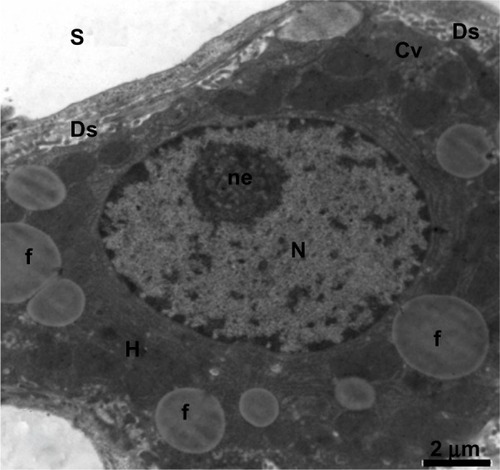
Figure 16 Transmission electron micrograph of a hepatic cell from the treated group showing intranuclear fat globules in the nucleoplasm. Note the well-developed cisternae of the rough endoplasmic reticulum, and the few mitochondria and small membranous vesicles. Scale bar 1 μm.
Abbreviations: f, fat globules; m, mitochondria; RER, rough endoplasmic reticulum; v, membranous vesicles.
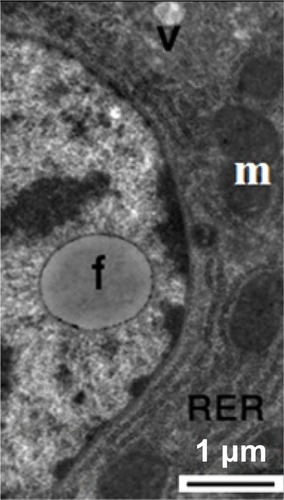
Figure 17 Transmission electron micrograph of a hepatic cell from the treated group showing some lipofuscin pigment, fragmented cisternae in the rough endoplasmic reticulum, and small membranous vesicles. Note the mitochondria. Scale bar 1 μm.
Abbreviations: Lp, lipofuscin pigment; m, mitochondria; RER, rough endoplasmic reticulum; v, membranous vesicles.
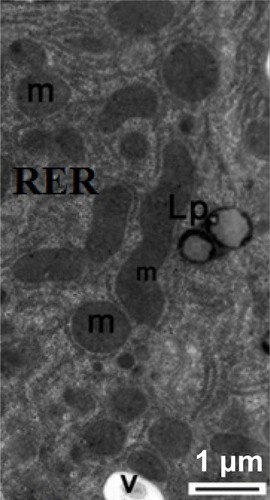
Figure 18 Transmission electron micrograph of a hepatic cell from the treated group containing numerous fat globules, rough endoplasmic reticulum, and mitochondria. Note Kupffer cells containing numerous endosomes and lysosomes filled with electron-dense material of silver nanoparticles (arrows) and the fragmented microvilli in Disse’s space could be seen between the hepatic cell and Kupffer cell. Scale bar 2 μm.
Abbreviations: Ds, Disse’s space; E, endosomes; f, fat globules; H, hepatocyte; Kc, Kupffer cells; Ly, lysosomes; m, mitochondria; N, nucleus; RER, rough endoplasmic reticulum.
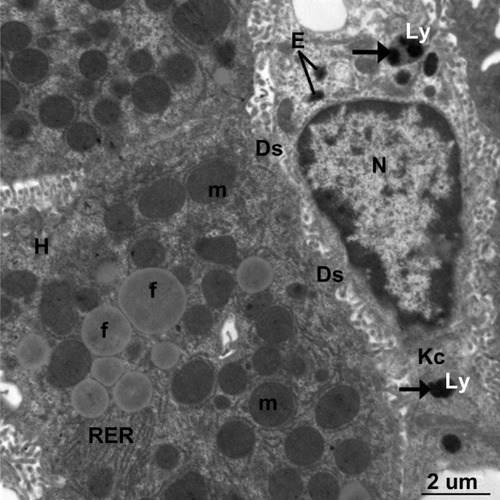
Figure 19 Transmission electron micrograph of a hepatic cell from the treatment group containing a small fat globule and numerous vesicles, fragmented cisternae of rough endoplasmic reticulum, and numerous mitochondria. Also shown is part of a Kupffer cell containing membranous cytoplasmic vacuoles and lysosomes along with electron-dense silver nanoparticles (arrows). Scale bar 2 μm.
Abbreviations: Cv, cytoplasmic vacuoles; f, fat globule; Kc, Kupffer cell; Ly, lysosomes; m, mitochondria; V, vesicles.
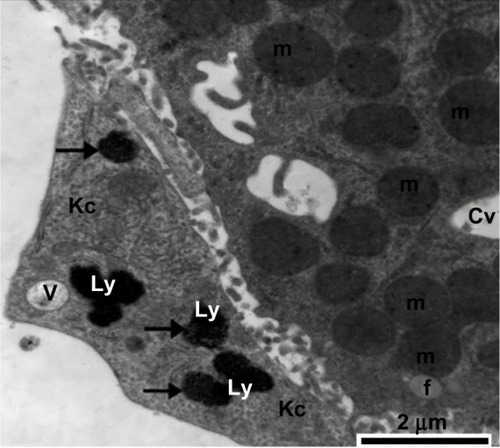
Figure 20 Higher magnification of the previous image, showing lysosomes in Kupffer cells filled with minute electron-dense silver nanoparticles (arrows). Notice the presence of part of a hepatocyte with its microvilli in Disse’s space. Scale bar 500 nm.
Abbreviations: Ds, Disse’s space; H, hepatocyte; Kc, Kupffer cells; Ly, lysosomes.
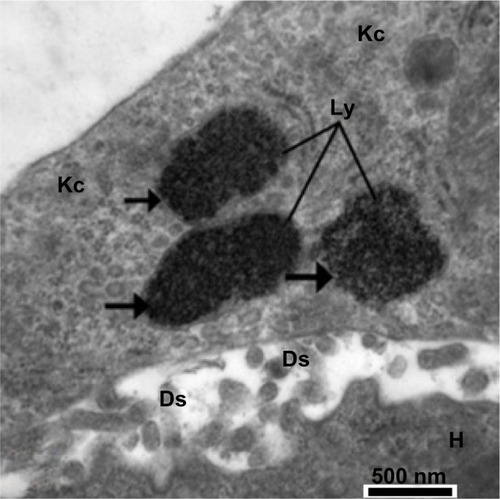
Figure 21 Transmission electron micrograph showing a hepatic cell from the treated group with numerous mitochondria, hypertrophied endothelial and Kupffer cells containing numerous membranous vesicles, and electron-dense silver nanoparticles (arrow) within a lysosome. The blood sinusoid contains an individual red blood cell. Note the fragmented microvilli in Disse’s space. Scale bar 2 μm.
Abbreviations: Ds, Disse’s space; en, endothelial cell; H, hepatic cell; Kc, Kupffer cells; Ly, lysosome; m, mitochondria; N, nucleus; RBC, red blood cell; S, blood sinusoid; V, vesicles.
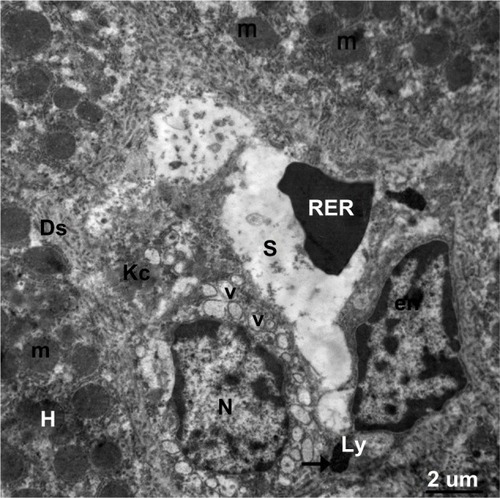
Figure 22 Higher magnification of the previous image, showing a large membranous vacuole, lysosomes in a Kupffer cell filled with minute electron-dense silver nanoparticles (arrow) and mitochondria with destroyed cristae. Note the degenerated nucleus surrounded by a fragmented nuclear envelope (stars). Scale bar 500 nm.
Abbreviations: Kc, Kupffer cell; Ly, lysosome; m, mitochondria; N, nucleus; V, vacuole.
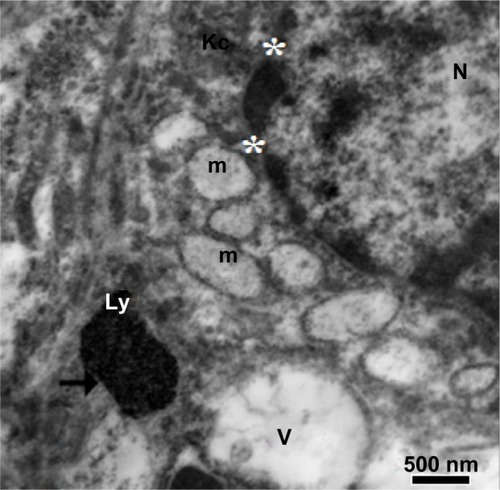
Figure 23 Transmission electron micrograph from the treated group. On the left, there is a cytoplasmic region of a degenerated hepatocyte consisting of numerous degenerated mitochondria, fragmented cisternae in the rough endoplasmic reticulum, and degenerated microvilli in Disse’s space. In the middle, there is a degenerated Kupffer cell containing a degenerated nucleus, degenerated mitochondria, and lysosomes filled with silver nanoparticles appearing as electron-dense material (arrows). Scale bar 2 μm.
Abbreviations: Ds, Disse’s space; H, hepatocyte; Kc, Kupffer cell; Ly, lysosomes; m, mitochondria; N, nucleus; RER, rough endoplasmic reticulum; S, blood sinusoid.
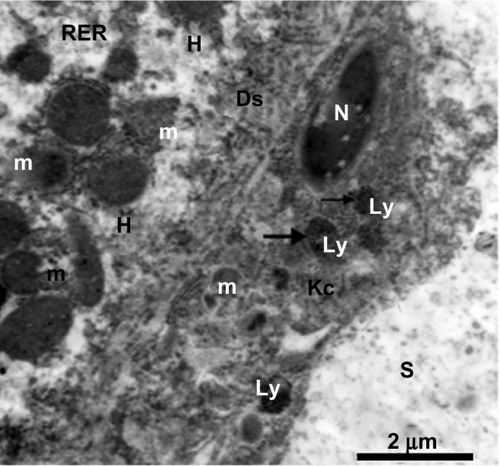
Table 1 Hematology results from control animals and those treated with silver nanoparticles
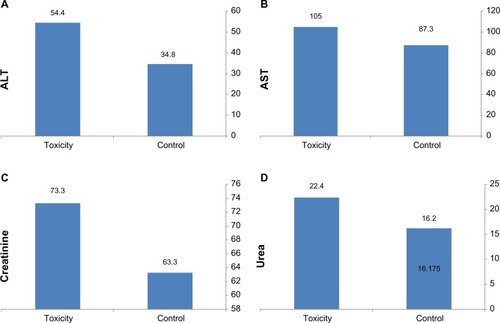
Figure 24 Biochemical results for control and treated rats. (A and B) Concentrations (U/L) of ALT and AST, respectively. (C and D) Concentrations (mg/dL) of creatinine and urea, respectively.
Abbreviations: ALT, alanine transferase; AST, aspartate transferase.