Figures & data
Table 1 The IC50 values for the cytotoxicity of SiO2 or ZnO NPs against U373MG cells at 24 hours
Figure 1 The effect of SiO2 NPs on the viability of U373MG cells.
Notes: U373MG cells were treated with various concentration of (A) SiO2EN100(R), (B) SiO2EN100(−), (C) SiO2EN20(R), or (D) SiO2EN20(−) NPs. At 24 hours after treatment, cell viability was determined with the CellTiter-Glo assay. To calculate the relative luciferase activities, the luciferase activities at 0 hours after treatment were set to 100%. The data shown here represent the results from three independent experiments.
Abbreviations: NPs, nanoparticles; RLU, relative luminescence units; SiO2, silicon dioxide.
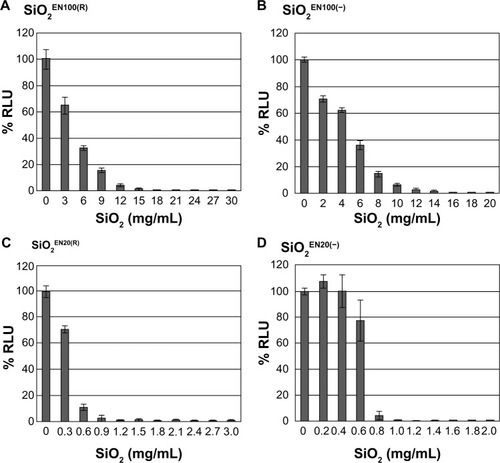
Figure 2 The effect of ZnO NPs on the viability of U373MG cells.
Notes: U373MG cells were treated with 0, 2, 5, 10, 15, or 20 μg/mL of (A) ZnOAE100(+), (B) ZnOAE100(−), (C) ZnOSM20(+), or (D) ZnOSM20(−) NPs. At 24 hours after treatment, cell viability was determined with the CellTiter-Glo assay. To calculate the relative luciferase activities, the luciferase activities at 0 hours after treatment were set to 100%. The data shown here represent the results from three independent experiments. Significant differences between samples were determined by the P-value of a two-sample t-test (P<0.05).
Abbreviations: NPs, nanoparticles; RLU, relative luminescence units; ZnO, zinc oxide.
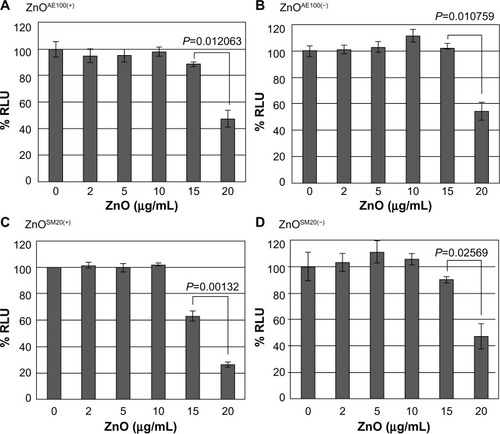
Figure 3 The effect of non-nano ZnCl2 on the viability of U373MG cells.
Notes: U373MG cells were treated with or without 20 μg/mL ZnCl2. At 24 hours after treatment, cell viability was determined with the Celltiter-Glo assay. To calculate the relative luciferase activities, the luciferase activities of mock-treated cells were set to 100%. The data shown here represent the results from three independent experiments.
Abbreviations: RLU, relative light unit; ZnCl2, zinc chloride.
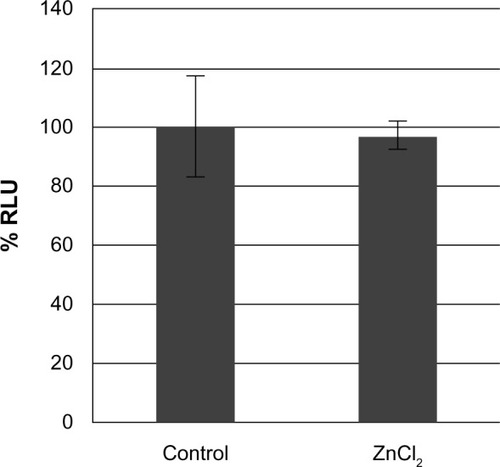
Figure 4 The effect of SiO2 NPs on caspase activation.
Notes: U373MG cells were treated with 9 mg/mL of (A) SiO2EN100(R) or (B) SiO2EN100(−) NPs, or 0.8 mg/mL of (C) SiO2EN20(R) or (D) SiO2EN20(−) NPs. At 0, 1, 3, 6 and 9 hours after treatment, PARP cleavage was determined by Western blot analysis.
Abbreviations: NPs, nanoparticles; PARP, poly-(adenosine diphosphate-ribose) polymerase; SiO2, silicon dioxide.
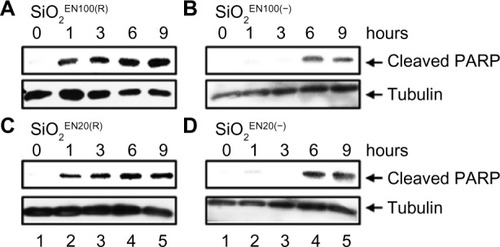
Figure 5 The effect of ZnO nanoparticles on caspase activation.
Notes: U373MG cells were treated with 20 μg/mL of (A) ZnOAE100(−), (B) ZnOSM20(−), (C) ZnOAE100(+), or (D) ZnOSM20(+) NPs. At 0, 1, 3, 6, 9 hours after treatment, PARP cleavage was determined by Western blot analysis.
Abbreviations: NPs, nanoparticles; PARP, poly-(adenosine diphosphate-ribose) polymerase; ZnO, zinc oxide.
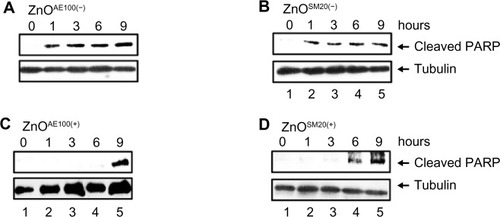
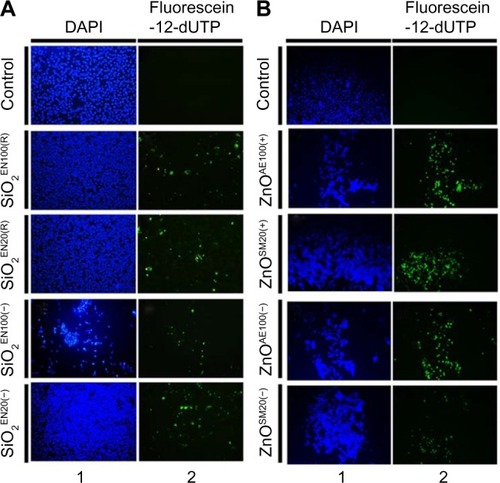
Figure 6 The effect of SiO2 or ZnO NPs on DNA fragmentation.
Notes: U373MG cells were treated with (A) SiO2 or (B) ZnO NPs with different sizes and surface charges at the concentrations described above. At 6 hours after treatment, fragmented DNA was labeled with fluorescein-12-UTP (green) and visualized under fluorescence microscopy. Nuclei were visualized by DAPI staining (blue).
Abbreviations: DAPI, 4′,6-diamidino-2-phenylindole; NPs, nanoparticles; SiO2, silicon dioxide; ZnO, zinc oxide; UTP, uridine triphosphate.