Figures & data
Table 1 Au NP characterization
Figure 1 Cell viability, evaluated by MTT assay, in PBL and Raw264.7 after 2 hours and 24 hours of exposure to 5 nm and 15 nm Au NPs.
Notes: PBL following 24 hours treatment with Au NP 15 nm showed a dose-effect relationship (P=0.01). Raw264.7 following 2 hours treatment with 5 nm Au NPs showed a dose-effect relationship (P=0.04) as well as after 24 hours treatment to 5 nm and 15 nm Au NPs (P=0.03 and P=0.016, respectively). Data show the percent of viable cells normalized to untreated control (±SEM, n=9). Statistically significant differences from the C− were determined by Student’s t-test (*P<0.05; **P<0.01; ***P<0.001).
Abbreviations: Au NP, gold nanoparticle; C+, positive control (10 μM hydrogen peroxide); C−, negative (untreated) control; h, hours; MTT, methylthiazol tetrazolium; PBL, peripheral blood lymphocytes; SEM, standard error of the mean.
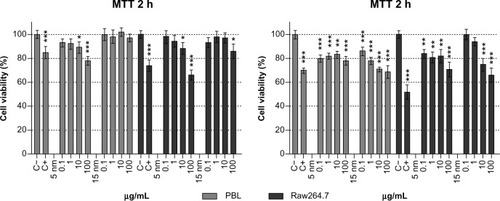
Table 2 Cytostasis and cytotoxicity evaluated by CBMN Cyt assay
Table 3 Genotoxicity evaluated by CBMN Cyt assay in PBL and Raw264.7 cells exposed to increasing mass concentrations of Au NPs
Figure 2 FISH analysis in PBL and Raw264.7 after exposure to 5 nm and 15 nm Au NPs.
Notes: Using pancentromeric probes applied to the CBMN Cyt slides, the centromeric spots were analyzed and the exposure of Raw264.7 to 15 nm Au NPs showed dose-dependent (P=0.01) aneuploidogenic events. Data are shown as mean ± SEM (PBL: n=4; Raw264.7: n=6). Student’s t-test: *P<0.05; **P<0.01; ***P<0.001.
Abbreviations: Au NP, gold nanoparticle; C+, positive control (MMC 0.1 μg/mL); C−, negative (untreated) control; CBMN Cyt, cytokinesis-block micronucleus cytome; FISH, fluorescence in situ hybridization; h, hours; MN C+, micronuclei centromere +ve; MN C−, micronuclei centromere -ve; PBL, peripheral blood lymphocytes; SEM, standard error of the mean.
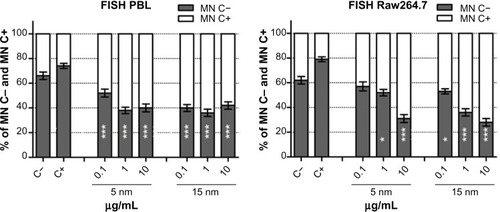
Figure 3 Comet assay to evaluate primary DNA damage/breakage effects in PBL and Raw264.7.
Notes: The 2-hour treatments with 5 nm and 15 nm Au NPs showed a dose-effect relationship in PBL (P=0.05 and P=0.002) and in Raw264.7 (P=0.0014 and P=0.03, respectively). The 24-hour exposure to 5 nm and 15 nm Au NPs showed a dose-effect relationship in Raw264.7 (P=0.0016 and P=0.004, respectively), but only 15 nm Au NPs in PBL (P=0.006). Data are shown as mean ± SEM (PBL: n=4; Raw264.7: n=6) of percent DNA in tail. Student’s t-test: 2-hour data, P<0.01; 24-hour data, P<0.001.
Abbreviations: Au NP, gold nanoparticle; C+, positive control (10 μM hydrogen peroxide); C−, negative (untreated) control; DNA, deoxyribonucleic acid; h, hours; PBL, peripheral blood lymphocytes; SEM, standard error of the mean.
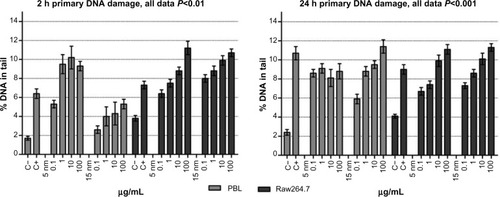
Figure 4 Oxidative DNA damage evaluated using the enzyme-modified comet assay in PBL and Raw264.7.
Notes: Dose-dependent pyrimidines oxidation was detected in PBL after 24 hours of exposure to 5 nm and 15 nm Au NPs (P=0.05 and P=0.028, respectively). In Raw264.7 the pyrimidines oxidation, detected by the EndoIII enzyme, showed a dose-dependent effect after 2 hours of exposure to 15 nm Au NPs (P=0.035) and at 24 hours to 5 nm and 15 nm Au NPs (P=0.009 and P=0.006, respectively). By Fpg, dose-dependent purines oxidation was observed in PBL after 2 hours of exposure to 5 nm and 15 nm Au NPs (P=0.009 and P=0.007, respectively), as well as after 24 hours of exposure to 5 nm Au NPs (P=0.014). In Raw264.7, a dose-effect relationship was detected following 2 hours of exposure to 15 nm Au NPs (P=0.01) and 24 hours of incubation in the presence of 5 nm Au NPs (P=0.015). Data are shown as mean ± SEM (PBL: n=4; Raw264.7: n=6) of percent DNA in tail. Student’s t-test: *P<0.05; **P<0.01; ***P<0.001.
Abbreviations: Au NP, gold nanoparticle; C+, positive control (10 μM hydrogen peroxide); C−, negative (untreated) control; DNA, deoxyribonucleic acid; EndoIII, endonuclease-III; Fpg, formamidopyrimidine-DNA glycosylase; h, hours; PBL, peripheral blood lymphocytes; SEM, standard error of the mean.
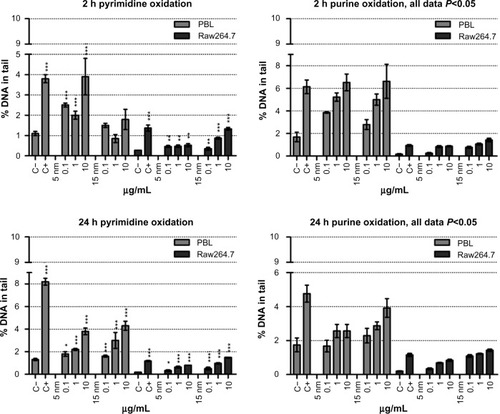
Table 4 Proliferation and genotoxicity evaluated by CBMN Cyt assay in Raw264.7 cells exposed to an absolute number of Au NPs
Figure 5 Cell viability in Raw264.7 after 2 hours and 24 hours of exposure to absolute numbers of 5 nm and 15 nm Au NPs.
Notes: Cells were exposed to 1.00×10⁹, 1.00×10¹⁰, and 1.00×10¹¹ Au NPs and evaluated by MTT assay. The data show the percent of living cells normalized to untreated control (±SEM, n=9). Statistically significant differences from the C− were determined by the Student’s t-test (*P<0.05). There were no statistically significant differences between the same number of 5 nm and 15 nm Au NPs.
Abbreviations: Au NP, gold nanoparticle; C+, positive control (10 μM hydrogen peroxide); C−, negative (untreated) control; h, hours; MTT, methylthiazol tetrazolium; SEM, standard error of the mean.
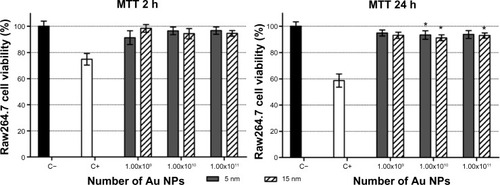
Figure S1 Cell viability evaluated by MTT assay in function of the theoretically calculated number of 5 nm and 15 nm Au NPs.
Notes: Mass concentrations (0.1–100 μg/mL) were expressed as theoretically calculated number of Au NPs ranging from 2.93×10¹² to 7.92×10¹⁶. In PBL (A and C) and Raw264.7 (B and D), after 2 hours (A and B) and 24 hours (C and D) treatment, no statistically significant differences among the cytotoxicity of 5 nm and 15 nm Au NPs were observed. Data show the percent of viable cells normalized to untreated control (± SEM, n=9). Statistical analysis was performed by Student’s t-test.
Abbreviations: Au NP, gold nanoparticles; MTT, methylthiazol tetrazolium; PBL, peripheral blood lymphocytes; SEM, standard error of the mean.
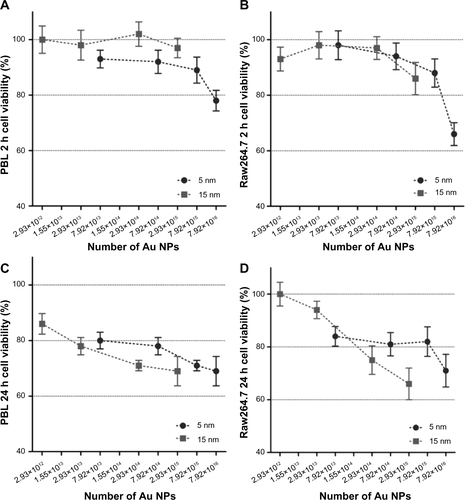
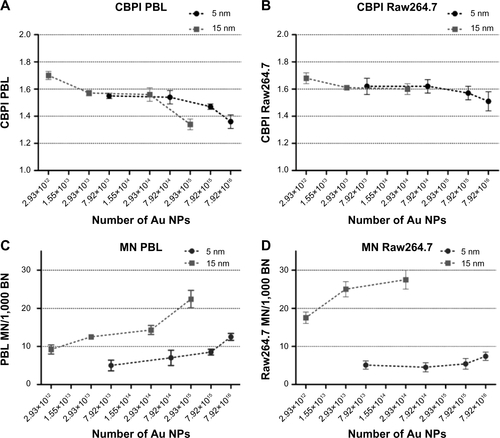
Figure S2 CBPI and MN frequency evaluated by CBMN Cyt assay in function of the theoretically calculated number of 5 nm and 15 nm Au NPs.
Notes: While CBPI shows no differences in antiproliferative activity of 5 nm and 15 Au NPs in PBL (A) and Raw264.7 (B), MN frequency was higher in PBL (C) and Raw264.7 (D) exposed to 15 nm Au NPs than to 5 nm (P<0.05). Data are shown as mean ± SEM (PBL: n=4; Raw264.7: n=6). Statistical analysis was performed by Student’s t-test.
Abbreviations: Au NP, gold nanoparticle; BN, binucleated cells; CBMN Cyt, cytokinesis-block micronucleus cytome; CBPI, cytokinesis block proliferation index; MN, micronuclei; PBL, peripheral blood lymphocytes; SEM, standard error of the mean.