Figures & data
Figure 1 Transmission electron micrographs of PLGA nanoparticles.
Notes: The transmission electron microscopic images of (A) unloaded and (B) miR-150-loaded nanoparticles. Scale bar is 1 μm.
Abbreviation: PLGA, poly (D,L-lactide-co-glycolide).
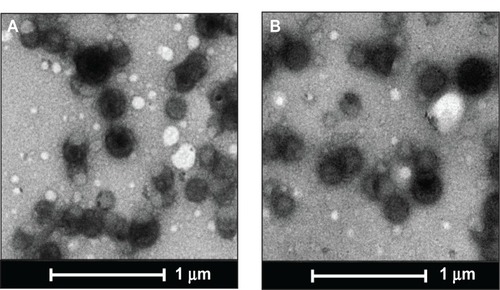
Figure 2 In vitro release profile of miR-150 mimic from miR-150-NF.
Notes: One milligram of miR-150-NF was incubated with 1 mL of release medium (Tris–EDTA buffer with or without 10% FBS, pH 7.4) in a rotary shaker at 100 rpm at 37°C. At 24 hour intervals, the nanoparticle suspension was centrifuged at 7,500 rpm for 10 minutes at 4°C. The amount of miR-150 in the supernatant was determined using ultraviolet spectrophotometry. The experiment was repeated three times and standard deviation was calculated.
Abbreviations: EDTA, ethylenediaminetetraacetic acid; NF, nanoformulation.
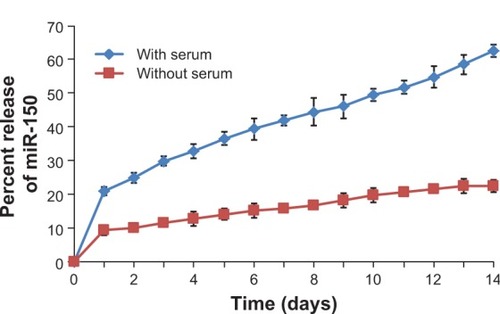
Figure 3 miR-150-NF delivers miR-150 mimics to pancreatic cancer cells efficiently.
Notes: Pancreatic cancer cells were seeded in six-well plates to reach 60%–70% confluence. Cells were treated with 0.1 mg of miR-150 mimics (with or without Lipofectamine [Thermo Fisher Scientific, Waltham, MA, USA]), miR-150-NF (0.05 mg [0.245 μg miR-150], 0.1 mg [0.69 μg miR-150], and 0.2 mg [1.38 μg miR-150]), blank (unloaded, 0.1 mg) PLGA nanoparticles. After 16 hours of transfection, medium was replaced with complete media and cells were further cultured for 48 hours. Expression of mature miR-150 was examined in cells by quantitative reverse-transcription-polymerase chain reaction. Comparable expression of miR-150 was observed after treatment of cells with 0.05 mg of miR-loaded NPs and miR-150 mimic (0.708 μg miR-150) with Lipofectamine, whereas significantly higher expression was observed in cells after treatment with miR-150-NF at concentrations of 0.1 mg and 0.2 mg. Results are presented as fold increase in miR-150 expression in various treatments in comparison to miRNA-150 alone. Bars represent mean ± standard deviation, n=3; *P<0.05; **P<0.001; ***P<0.0001.
Abbreviations: miR, microRNA; NF, nanoformulation; NPs, nanoparticles.
![Figure 3 miR-150-NF delivers miR-150 mimics to pancreatic cancer cells efficiently.Notes: Pancreatic cancer cells were seeded in six-well plates to reach 60%–70% confluence. Cells were treated with 0.1 mg of miR-150 mimics (with or without Lipofectamine [Thermo Fisher Scientific, Waltham, MA, USA]), miR-150-NF (0.05 mg [0.245 μg miR-150], 0.1 mg [0.69 μg miR-150], and 0.2 mg [1.38 μg miR-150]), blank (unloaded, 0.1 mg) PLGA nanoparticles. After 16 hours of transfection, medium was replaced with complete media and cells were further cultured for 48 hours. Expression of mature miR-150 was examined in cells by quantitative reverse-transcription-polymerase chain reaction. Comparable expression of miR-150 was observed after treatment of cells with 0.05 mg of miR-loaded NPs and miR-150 mimic (0.708 μg miR-150) with Lipofectamine, whereas significantly higher expression was observed in cells after treatment with miR-150-NF at concentrations of 0.1 mg and 0.2 mg. Results are presented as fold increase in miR-150 expression in various treatments in comparison to miRNA-150 alone. Bars represent mean ± standard deviation, n=3; *P<0.05; **P<0.001; ***P<0.0001.Abbreviations: miR, microRNA; NF, nanoformulation; NPs, nanoparticles.](/cms/asset/4949f46a-5ca6-4ded-a755-c09f77556e46/dijn_a_61949_f0003_c.jpg)
Figure 4 miR-150-NF represses MUC4 expression, HER2 expression, and HER2 downstream signaling in pancreatic cancer cells.
Notes: Colo-357 and HPAF cells were treated with blank NPs (0.1 mg), miR-150-NF (0.05 or 0.1 mg), or miR-150 with Lipofectamine (Thermo Fisher Scientific, Waltham, MA) for 48 hours. Immunoblotting was performed for MUC4, HER2, p-HER2, ERK1/2, pERK1/2, FAK, and pFAK. β-actin was used as a loading control.
Abbreviations: lipo, Lipofectamine; NF, nanoformulation; NPs, nanoparticles; MUC4, Mucin 4; HER2, human epidermal growth factor receptor 2; pHER2, phosphorylated HER2; ERK, extracellular signal-regulated kinase; pERK, phosphorylated ERK; FAK, focal adhesion kinase; pFAK, phosphorylated FAK.
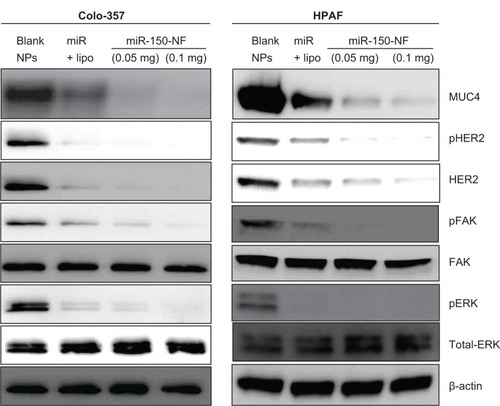
Figure 5 Treatment of pancreatic cancer cells with miR-150-NF alters the morphology of pancreatic cancer cells.
Notes: Pancreatic cancer cells were seeded in six-well plates and allowed to attain 60%–70% confluence prior to miR-150-NF (0.05 or 0.1 mg/mL) treatment for 48 hours. Representative micrographs are from one of the random fields of view (magnification 100×) of cells.
Abbreviation: NF, nanoformulation.
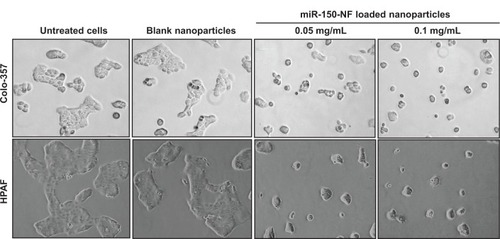
Figure 6 miR-150-NF decreases growth and clonogenicity of pancreatic cancer cells.
Notes: (A) Colo-357 and HPAF cells (2×10³ per well) were seeded in 96-well plates. After 24 hours (considered as day 0), cells were treated with either miR-150-NF or blank NPs (0.05 mg each) and growth was monitored by WST-1 assay every day for next 5 days. After analysis, data were presented as relative fold-growth induction compared with growth of cells at day 0. Growth inhibition of cells treated with miR-150-NF was compared to cells treated with blank NPs on day 5 and is shown as percentage. Bars represent mean ± SD (n=3); *P<0.05; **P<0.001. (B) Pancreatic cancer cells were treated with miR-150 mimics-loaded or blank NPs and, 48 hours later, cells were trypsinized and seeded in six-well plates (1×10³ cells per well) for clonogenicity assay. After 2 weeks, colonies were stained with 0.1% crystal violet, photographed, and counted using imaging system. Data are presented as percent inhibition of clonogenic ability of miR-150-NF-treated cells as compared with their respective controls. Bars represent the mean of total number of colonies ± SD (n=3); *P<0.05.
Abbreviations: miR, microRNA; NF, nanoformulation; NPs, nanoparticles; SD, standard deviation.
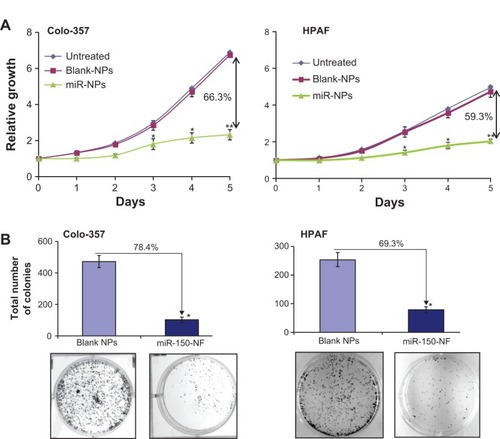
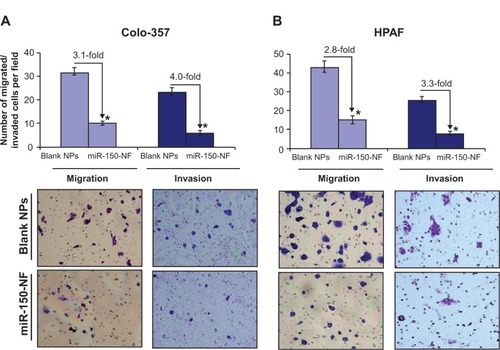
Figure 7 Treatment with miR-150-NF decreases the motility and invasion of pancreatic cancer cells.
Notes: (A) Colo-357 and (B) HPAF cells were treated with miR-150-NF or blank NPs for 48 hours as described above. Cells were trypsinized and seeded (1×10⁶ and 2.5×10⁵ for migration and invasion, respectively) in serum-deprived media on non-coated or Matrigel-coated membranes for motility and invasion assays, respectively. Medium containing 10% FBS was added in the lower chamber as a chemoattractant and incubated for 16 hours in transwell plates. Cells that had migrated/invaded through the membrane/Matrigel to the bottom of the insert were fixed, stained, photographed using inverted phase contrast microscope, and counted in ten random view fields. Bars represent the mean ± standard deviation (n=3) of number of migrated/invaded cells per field; *P<0.05.
Abbreviations: FBS, fetal bovine serum; NF, nanoformulation; NPs, nanoparticles.