Figures & data
Figure 1 Electronic configuration of the ultrasound tissue bath system.
Notes: Two submersible ultrasound transducers are coupled to the reservoir: a transmit transducer (1 MHz, 3% duty cycle, blue) focuses on the lumen of the artery, while a second receive transducer (7 MHz, orange) detects cavitation emissions from nitric oxide-loaded bubble liposomes perfused within the vessel lumen (red) via a 26-gauge blunt injection needle.
Abbreviation: US, ultrasound.
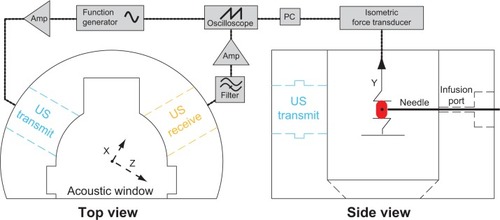
Figure 2 In situ ultrasound beam profiles of the 1 MHz and 7.5 MHz transducers.
Notes: The –3 dB contours of the transmit field (blue) and receive sensitivity (orange) are depicted, along with the anticipated location of the artery (red, box).
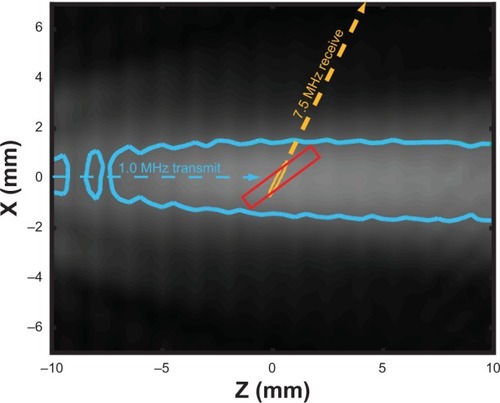
Figure 3 Graphical representation of the signal processing technique used to assess cavitation emissions detected by the single element passive cavitation detector.
Notes: (A) Scattered pulses detected by the passive cavitation detector were filtered (1 MHz low pass filter), amplified (10×), digitized, and saved to a PC in sequence mode. Individual pulses were windowed in the time domain (B), and then transformed into the frequency domain. Ultraharmonic and broadband components of the power spectrum (C) were quantified, and served as indicators of stable and inertial cavitation, respectively.
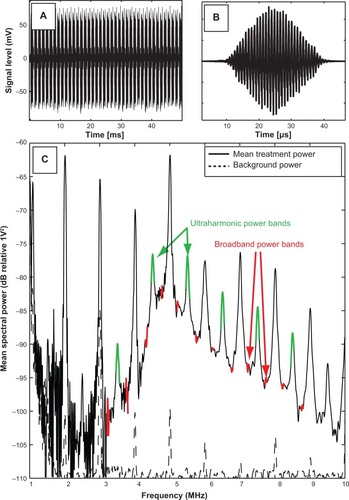
Figure 4 Timeline of procedures performed during a typical experimental exposure.
Notes: Repeated measurements were made in series following 35 mM potassium chloride washes, followed by tension equilibration.
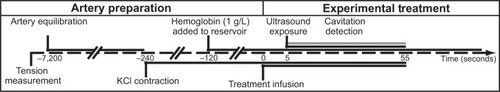
Figure 5 Representative tension reduction (relative to the maximum KCl contraction tension) for buffer + US, buffer + NOBLs, NOBLs + US (peak-to-peak acoustic pressure amplitude 0.34 MPa), and control agonist sodium nitroprusside. Each treatment’s minimum tension (maximal relaxation) was used for grouped analysis.
Abbreviations: SNP, sodium nitroprusside; NOBLs, nitric-oxide loaded bubble liposomes; US, ultrasound.
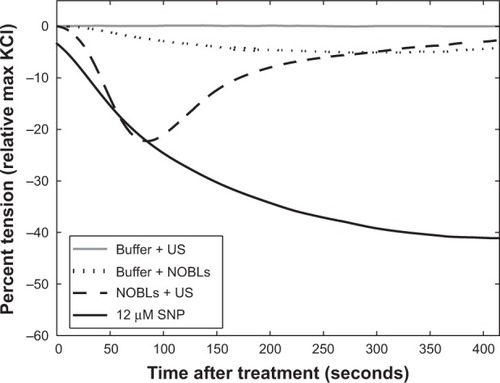
Figure 6 (A) Size distribution (n=3) of the NOBLs, weighted by volume (black) and number density (gray).
Notes: The presence of particles >4 μM (by volume) agrees with Endo-Takahashi et al.Citation34 Dots indicate one standard deviation. (B) Acoustic attenuation as a function of frequency, as determined using the system described in Raymond et al.Citation36
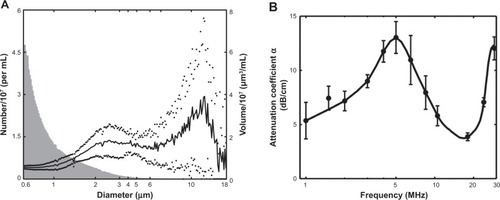
Figure 7 Spectral analysis of scattered acoustic signal from NOBLs.
Notes: Averaged spectrum of detected cavitation emissions across a 50-second ultrasound exposure during NOBL infusion into the lumen of a carotid artery (solid), compared to spectral emission from sham ultrasound exposures (buffer + ultrasound alone, dotted). (A) Ultraharmonic (eg, 3f/2, 5f/2.) and (B) broadband frequency components of the transmitted fundamental frequency (f, 1 MHz) were consistently observed, indicating strong, persistent nonlinear bubble activity. Black circles indicate the mean of the local data group, bars indicate ± one standard deviation.
Abbreviation: NOBLs, nitric oxide-loaded bubble liposomes.
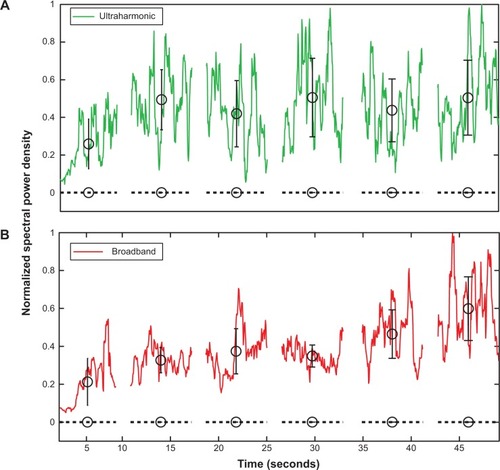
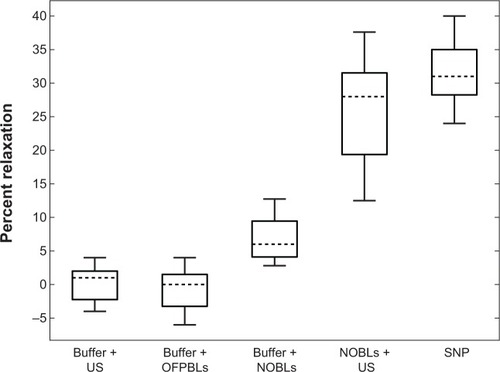
Figure 8 Carotid artery vasorelaxation as a function of treatment.
Notes: Data means are indicated by horizontal dotted lines and boxes indicate the 25th and 75th percentiles. The range of adjacent data is indicated by error bars. Seven arterial rings from seven pigs were used for all treatments. Statistically significant differences in data means (P<0.05) were observed between all data sets except (A) buffer + US/buffer + OFPBL and (B) NOBLs + US/SNP.
Abbreviations: SNP, 12 μM sodium nitroprusside; US, ultrasound; NOBLs, nitric-oxide loaded bubble liposomes; OFPBL, octafluoropropane-loaded bubble liposomes.