Figures & data
Figure 1 Schematic diagram of AgO-deposited TiNT formation.
Notes: (A) Anodization process is shown. Ag ions moved toward carbon cathode, which was negatively biased with respect to Ti. Ag atoms were deposited on the cathode while TiNT were formed on Ti foil which was positively biased. (B) Ag electroplating process is shown. The polarity was reversed and Ag+ ions moved toward negatively biased Ti with respect to carbon cathode. Ag atoms deposited on the TiNT layer on Ti.
Abbreviation: TiNT, TiO2 nanotubes.
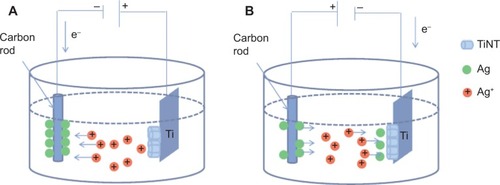
Figure 2 SEM images of AgO-deposited TiNT.
Notes: Treated with different Ag electroplating time: (A) 30s (TiNT-Ag30s), (B) 60s (TiNT-Ag60s), (C) 90s (TiNT-Ag90s) and (D) EDS results of TiNT-Ag90s. AFM images of TiNT-Ag60s: (E) topography and (F) surface potential. The circular marked area in the topography image is the area with high surface potential. SEM images show nanoparticles (about 80 nm) on the surface of the Ag-deposited TiNT surface. More nanoparticles were formed on samples with longer electroplating time. The EDS data show a small peak of Ag at 3 keV. AFM surface potential image shows some bright areas related to the higher Ag potential compared to TiNT substrate.
Abbreviations: SEM, scanning electron microscopy; TiNT, TiO2 nanotubes; EDS, energy-dispersive X-ray spectroscopy; AFM, atomic force microscopy.
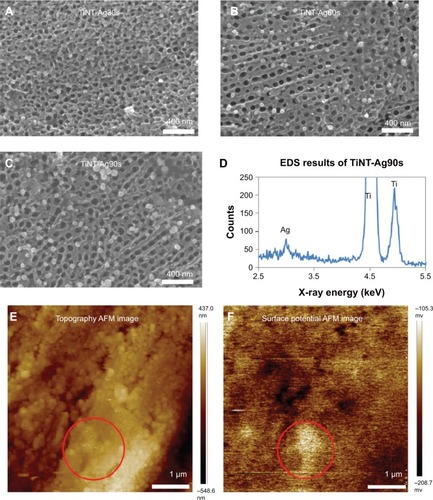
Figure 3 TEM images of TiNT-Ag60s.
Notes: (A) Morphology of AgO-deposited TiNT, (B) enlargement of black AgO nanoparticles on TiNT (red circles indicate some black AgO particles). (C) High resolution image of AgO nanoparticles and (D) diffraction pattern of AgO. Some 5–10 nm black particles were found inside the TiNT. Based on diffraction pattern, the crystal structures of black nanoparticles and substrate were monoclinic AgO and amorphous TiO2, respectively.
Abbreviations: TiNT, TiO2 nanotubes; TiNT-Ag60s, TiNT treated with Ag electroplating time of 60 seconds; TEM, transmission electron microscope.
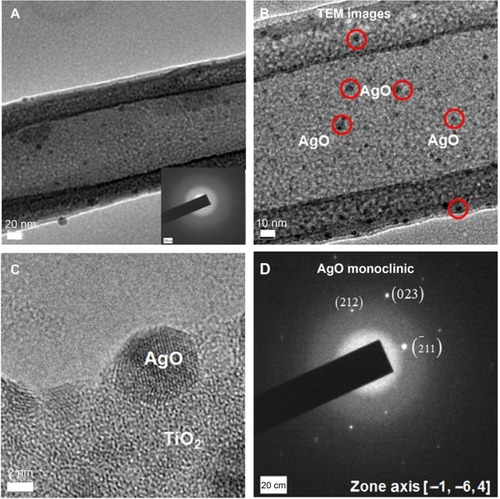
Figure 4 High resolution X-ray photon spectroscopy (XPS) spectrum of Ag 3d in TiNT-Ag60s (367.4 eV is the Ag 3d5/2 peak for AgO).
Note: The XPS spectrum of Ag 3d confirmed that the nanoparticles were composed of AgO.
Abbreviation: TiNT, TiO2 nanotubes ; TiNT-Ag60s, TiNT treated with Ag electroplating time of 60 seconds.
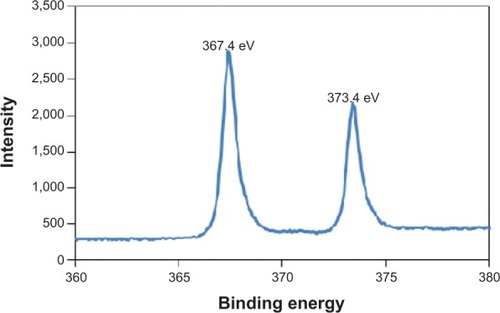
Figure 5 Cumulative release of Ag from TiNT and AgO-deposited samples soaked in cell culture medium at 37°C.
Notes: Experiment results were expressed as means ± standard deviation of the means of the samples (n=3). The released Ag was from the trapped electrolyte in the TiO2 nanotubes. The amount of Ag released from the AgO-deposited samples increased with the electroplating time. The Ag release followed the exponential curve. Ag30s, 60s, or 90s refer to treatment with an Ag electroplating time of 30, 60, or 90 seconds, respectively.
Abbreviation: TiNT, TiO2 nanotubes.
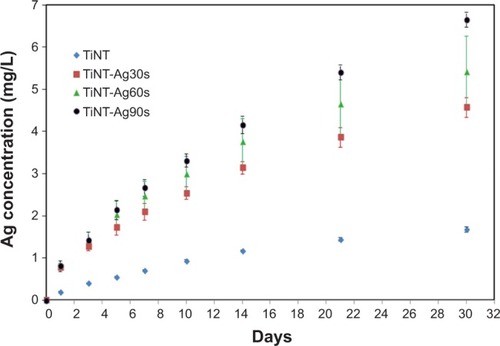
Figure 6 Cellular activity analysis of TiO2 nanotubes.
Notes: (A) Cell viability test results by LDH assay for 1 and 4 days on the samples (n=4). At Day 1, the LDH activity of all the samples were similar. After 4 days, the TiNT and AgO-deposited samples showed a higher LDH activity, which means increased cytotoxicity to MC3T3 cells. (B) Cell proliferation determined by DNA amount after MC3T3 cells were cultured for 1 and 4 days on the samples (n=4). The DNA amount of TiNT was about half of Ti samples on Day 1 and Day 4, which indicated that cell proliferation of TiNT samples is about 50% less than that of Ti samples. AgO-deposited samples showed much lower cell proliferation than that of Ti samples on Day 1 and 4. AgO nanoparticles induced cytotoxicity for MC3T3 cells at relatively low Ag release. The statistical significance was calculated by ANOVA test. (**P<0.01 and *P<0.05). Ag30s, 60s, or 90s refer to treatment with an Ag electroplating time of 30, 60, or 90 seconds, respectively.
Abbreviations: ANOVA, analysis of variance; LDH, lactate dehydrogenase; TiNT, TiO2 nanotubes.
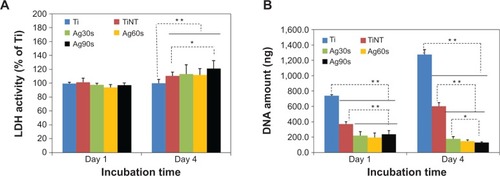
Figure 7 Zone of inhibition (ZoI) for samples exposed to Escherichia coli on Day 1.
Notes: Ti and TiNT samples did not show ZoI. All AgO-deposited samples showed similar ZoI (diameter: 7 mm) due to similar Ag release on Day 1. AgO-deposited TiNT showed good antimicrobial effects. (A) Ti plate, (B) TiNT control, (C) TiNT-Ag30s, (D) TiNT-Ag60s, (E) TiNT-Ag90s. Ag30s, 60s, or 90s refer to treatment with an Ag electroplating time of 30, 60, or 90 seconds, respectively.
Abbreviation: TiNT, TiO2 nanotubes.
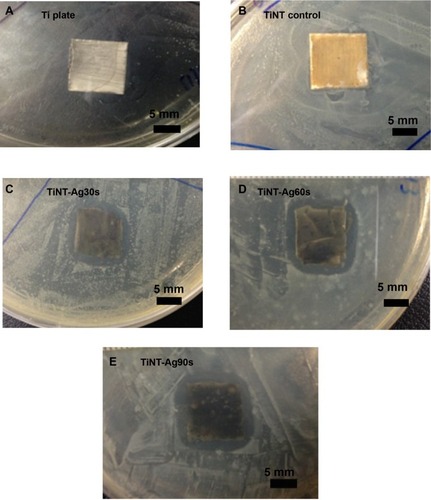
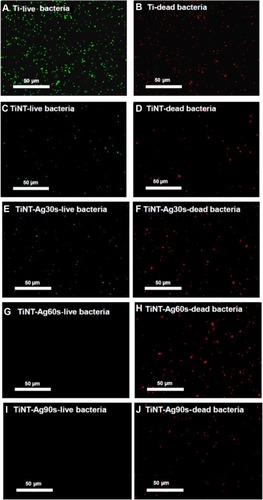
Figure 8 Fluorescent images of bacteria viability after 7 days of incubation (acridine orange and ethidium bromide fluorescence staining).
Notes: Live bacteria appear green and dead cells are red. A lot of bacteria were found at the Ti plate samples. TiNT samples’ surface had some dead bacteria. The surface of TiNT-Ag60s and Ag90s samples did not show any viable bacteria. Ag30s, 60s, or 90s refer to treatment with an Ag electroplating time of 30, 60, or 90 seconds, respectively.
Abbreviation: TiNT, TiO2 nanotubes.