Figures & data
Table 1 Comparison of properties of urine from healthy controls and CaOx stone-forming patients (n=9)
Figure 1 X-ray diffraction spectra of stones in two representative calcium oxalate stone patients.
Notes: (A) patient A, (B) patient B. apeak at d=2.26 (202), bpeak at d=2.24 (213). The black arrows indicate the corresponding peaks and crystal faces. ★calcium oxalate monohydrate, ✰calcium oxalate dihydrate.
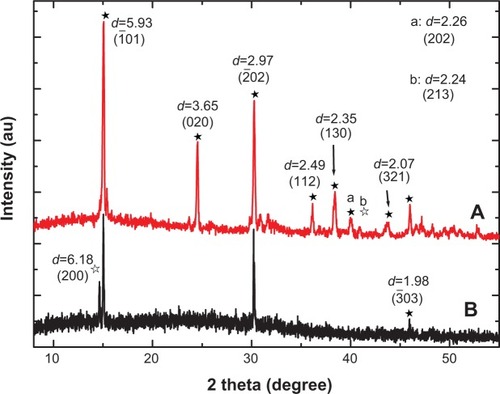
Figure 2 High-resolution transmission electron microscopy images of urinary nanocrystallites of two representative calcium oxalate stone patients.
Notes: (A) Patient A, the bar: 500 nm; (B) patient B, the bar: 200 nm.
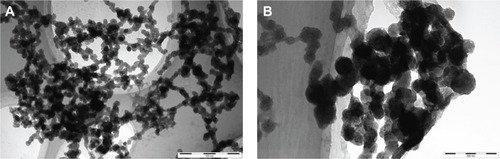
Figure 3 Fast Fourier transformation (FFT) images of high-resolution transmission electron microscopy in different areas of urinary nanocrystallites in one representative calcium oxalate stone patient.
Notes: (A–D) show patients A–D, respectively. a and b show the FFT diffraction patterns transformed from the respective yellow boxes in A.
Abbreviation: d, interplanar spacing.
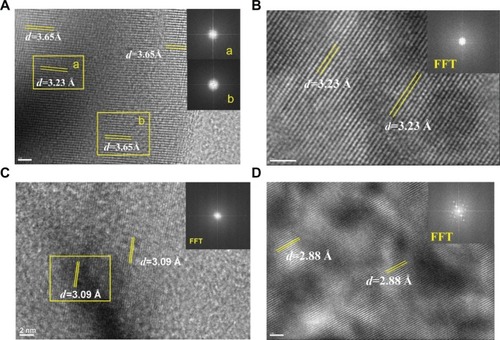
Table 2 High-resolution transmission electron microscopy diffraction data and attributes in different areas of urinary crystallites in patients with calcium oxalate stones
Figure 4 Selected area electron diffraction images in different areas of urinary crystallites in one patient with calcium oxalate stones.
Note: (A) patient D, (B) patient A.
Abbreviation: d, interplanar spacing.
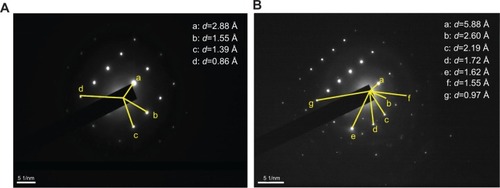
Figure 5 High-resolution transmission electron microscopy and selected area electron diffraction images of urinary nanocrystallites of one representative calcium oxalate stone patient. The bar: (A) 100 nm, (B) 10 nm, (C) 5 nm, (D) 2 1/nm.
Notes: The areas B, C, and D in (A) are enlarged in (B), (C), and (D), respectively. a and b show the FFT diffraction patterns transformed from the respective yellow boxes in B.
Abbreviations: CaP, calcium phosphate; COM, calcium oxalate monohydrate; d, interplanar spacing.
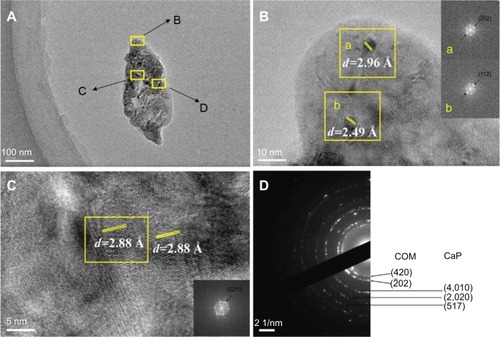
Figure 6 Atomic ratios from energy dispersive X-ray spectroscopy analysis of the central and surrounding regions of different urinary crystallites from calcium oxalate monohydrate stone patients.
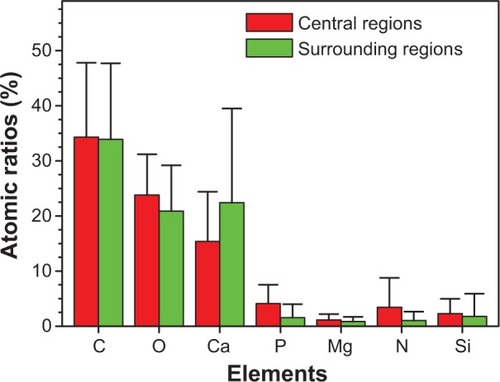
Figure 7 Energy dispersive X-ray spectroscopy analysis of the elemental distribution of urinary crystallite of a representative calcium oxalate stone patient.
Notes: (A, C) High-resolution transmission electron microscopy images; (B, D) element distribution, in which (A, B) show the central part, and (C, D) show the outside part of urinary crystallites.
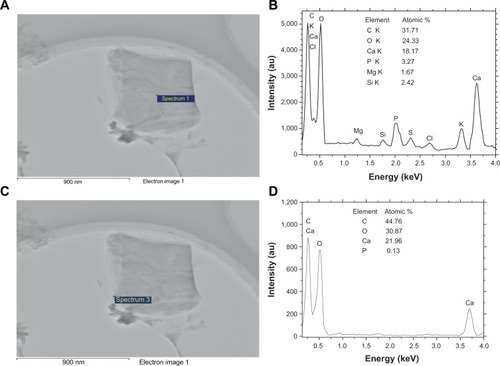
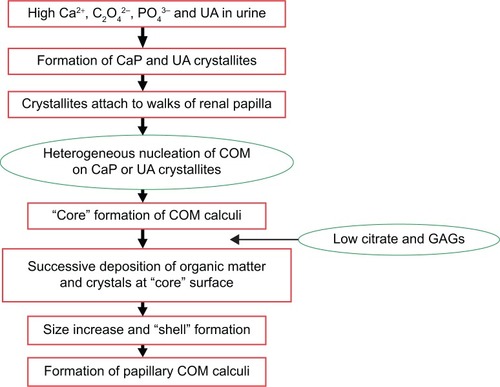
Figure 8 Schema of the process of papillary COM renal stone formation.
Abbreviations: CaP, calcium phosphate; COM, calcium oxalate monohydrate; GAGs, glycosaminoglycans; UA, uric acid.