Figures & data
Figure 1 Schematic representation of Arg-G4-based PHD2 silencing system combined with MSC transplantation for infarcted myocardium repair.
Abbreviations: Arg-G4, arginine-terminated G4; G4, generation 4 poly(amidoamine); MI, myocardial infarction; MSC, mesenchymal stem cell; PHD2, prolyl hydroxylase domain protein 2; siRNA, small interfering RNA.
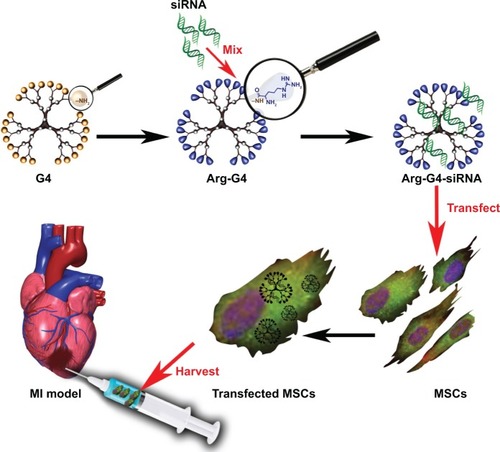
Figure 2 Characterizations of Arg-G4-siRNA complexes.
Notes: (A) Particle size at various N/P ratios. (B) Zeta potential at various N/P ratios. (C) Transmission electron microscopy image of Arg-G4-siRNA complexes at N/P ratio of 10. (D) Arg-G4 encapsulated and naked siRNA against RNase A digestion.
Abbreviations: Arg-G4, arginine-terminated G4; G4, generation 4 poly(amidoamine); N/P, nanoparticle to DNA nitrogen-phosphorus; siRNA, small interfering RNA.
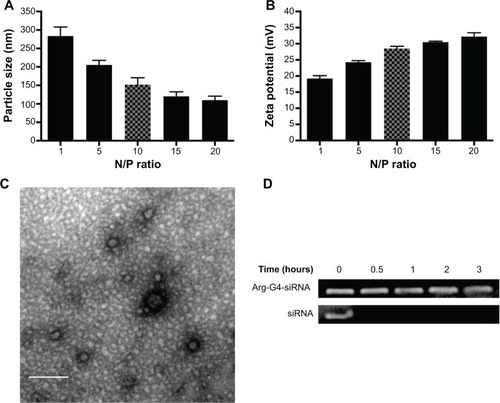
Figure 3 Optimization of Arg-G4-based gene silencing.
Notes: (A) Arg-G4-siRNA transfection efficiency in MSCs at various N/P ratios using Lipofectamine 2000 as a control. (B) Cell viability in MSCs during transfection at various N/P ratios using Lipofectamine 2000 as a control. (C) Arg-G4-siRNA transfection efficiency in MSCs using various siRNA concentrations. (D) Cell viability in MSCs during transfection using various siRNA concentrations. *P<0.05 versus transfection efficiency or cell viability at N/P ratio of 10.
Abbreviations: Arg-G4, arginine-terminated G4; G4, generation 4 poly(amidoamine); Lipo, Lipofectamine 2000; MSC, mesenchymal stem cell; N/P, nanoparticle to DNA nitrogen-phosphorus; siRNA, small interfering RNA.
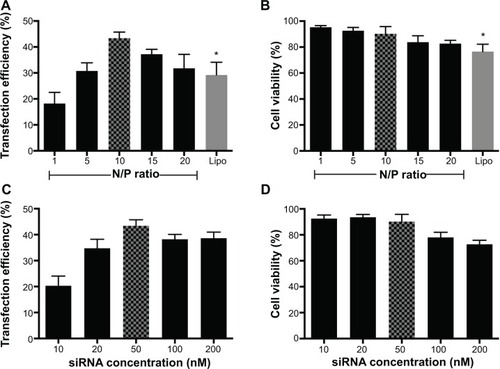
Figure 4 Assessment of the optimized gene silencing system.
Notes: (A) Real-time MSCs bio-behaviors during transfection. (B) Cell proliferation of non-transfected and transfected MSCs during 48 hours after transfection. (C) Cell apoptosis of non-transfected and transfected MSCs at 48 hours after transfection. (D) FAM-tagged siRNA transfected into MSCs. Scale bar =50 μm. (E) PHD2 mRNA expression after siRNA transfection. †P>0.05 versus non-transfected MSCs; *P<0.05, **P<0.01 versus non-transfected MSCs.
Abbreviations: FAM, carboxyfluorescein; h, hour; mRNA, messenger RNA; MSC, mesenchymal stem cell; PHD2, prolyl hydroxylase domain protein 2; siRNA, small interfering RNA.
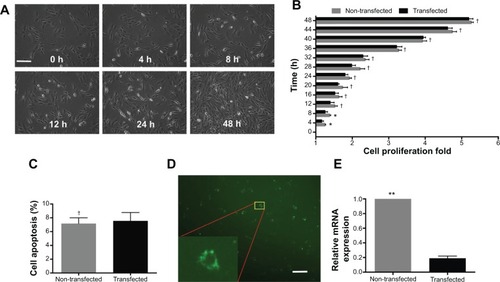
Figure 5 In vivo measurement of Arg-G4-siRNA transfected MSC transplantation.
Notes: (A) Percentage of graft MSCs in Groups 2 and 3 at 2 hours, and 1, 3, and 7 days after transplantation. (B) IGF-1 expression in myocardium. (C) TUNEL-labeled apoptotic nuclei and DAPI-labeled myocardial nuclei at the peri-infarcted zone (red, apoptotic nuclei; blue, all myocardial nuclei; purple, merge vision of apoptotic nuclei) (scale bar =100 μm); infarct size (scale bar =1 mm) and interstitial fibrosis (scale bar =50 μm) determined by Masson trichrome; capillaries (brown color, red arrow) and arterioles (brown color, green arrow) at the peri-infarcted zone (scale bar =50 μm). (D) Apoptotic cell percentage at the peri-infarcted zone. (E) Scar size at 28 days after MI. (F) Interstitial fibrosis of left ventricle. (G) Capillary density based on PECAM-1 staining. (H) Arteriole density based on α-SMA staining. †P>0.05 versus Group 2; *P<0.05 versus Group 2; **P<0.01 versus Group 2; #P<0.05 versus Group 1; ##P<0.01 versus Group 1.
Abbreviations: α-SMA, alpha-smooth muscle actin; Arg-G4, arginine-terminated G4; DAPI, 4′,6-diamidino-2-phenylindole; G4, generation 4 poly(amidoamine); IGF-1, insulin-like growth factor-1; MI, myocardial infarction; MSC, mesenchymal stem cell; siRNA, small interfering RNA; TUNEL, terminal deoxynucleotidyl transferase dUTP nick end labeling.
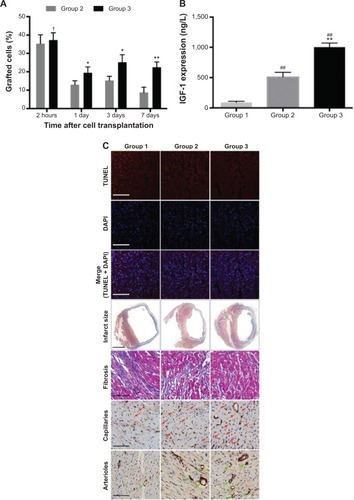
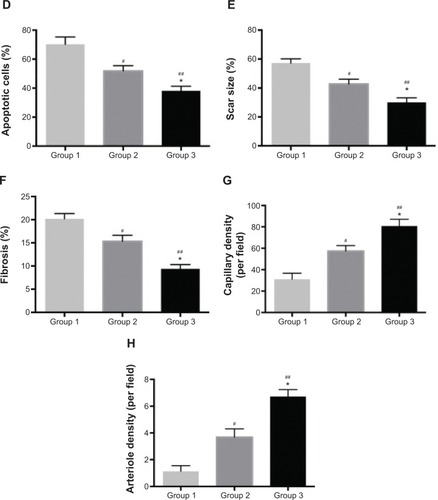
Figure 6 Heart function assessment.
Notes: (A) M-mode echocardiogram of three groups at 28 days after MI. (B) LVEF of three groups at 1 day and at 28 days after MI. (C) LVFS of three groups at 1 day and at 28 days after MI. *P<0.05 versus Group 2; ##P<0.01 versus Group 1.
Abbreviations: d, day; LVEF, left ventricular ejection fraction; LVFS, left ventricular fractional shortening; MI, myocardial infarction.
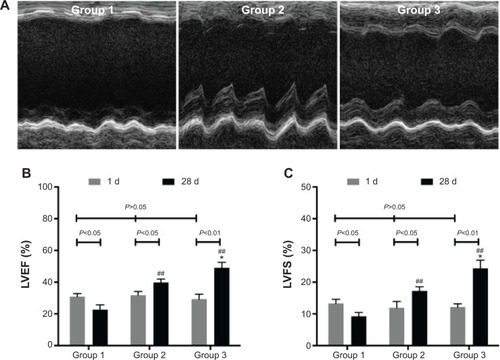
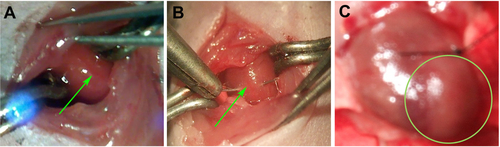
Figure S1 Construction of MI models on C57/BL6 mice.
Notes: (A) Exposure of LAD (green arrow) through a 2 cm incision at the left lateral costal rib. (B) Permanent ligation of LAD (green arrow) with an 8-0 silk suture. (C) Ischemia was confirmed by visual inspection of blanching in the myocardium distal to the site of occlusion (green circle).
Abbreviations: LAD, left anterior descending coronary artery; MI, myocardial infarction.