Figures & data
Table 1 Baseline Characteristics, as Self-Reported by Patients
Figure 1 Knowledge of hemoglobin levels.
Notes: Charts show the percentages of patients who selected each response to the question, “If you’ve had a blood test in the past year, do you know what your hemoglobin level is?”.
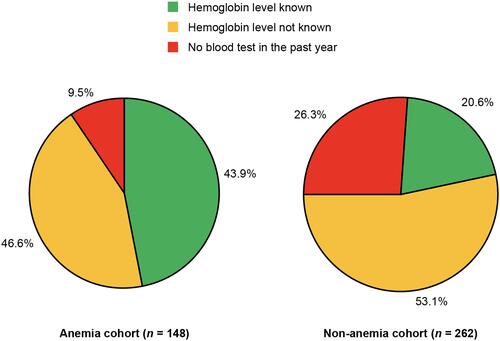
Figure 2 Beliefs about anemia and its causes.
Notes: Graph shows the percentages of patients who selected each statement in response to the question, “Which of the following statements about anemia do you think are correct?”.
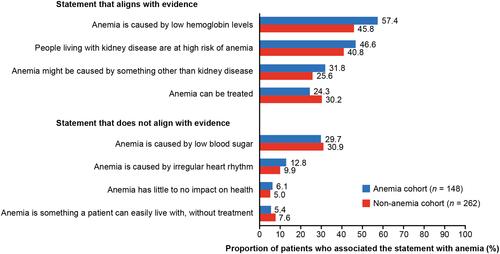
Figure 3 Beliefs about the symptoms of anemia.
Notes: Graph shows the percentages of patients who selected each statement in response to the question, “Which of the following do you think are symptoms of anemia?”.
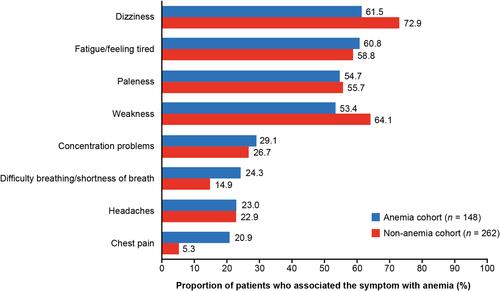
Figure 4 Knowledge of anemia treatment options.
Notes: Graph shows the percentages of patients who responded to the question, “Do you know about the different treatments that are available for managing anemia and, if so, how did you find out?”.
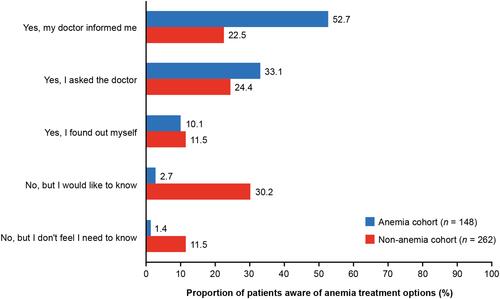
Figure 5 Physical (A) and emotional (B) HRQoL (anemia cohort, n=148).
Notes: Graphs show the percentages of patients who selected each response to the question when presented with a list of statements that are commonly reported by patients with chronic conditions. Arrow length indicates the percentage of patients who stated that a particular activity or feeling was made worse by their anemia. HRQoL, health-related quality of life.
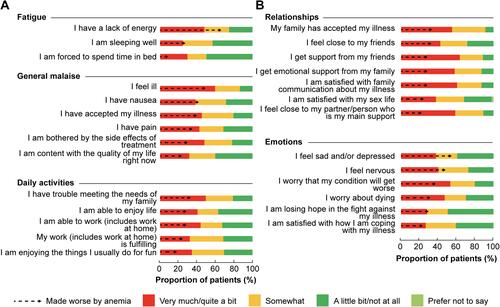
Figure 6 Patient-reported treatments received for anemiaa (A) and patient perceptions of anemia managementb (B) (anemia cohort, n=148). aPercentage of patients who responded to the question, “How is your doctor managing your anemia?” bPercentage of patients who selected each response to the question, “On a scale from 1 to 5, how well do you think your anemia is managed, with 1 being ’very badly managed’, 3 being ‘neither badly nor well managed’, and 5 being ‘very well managed’?”.
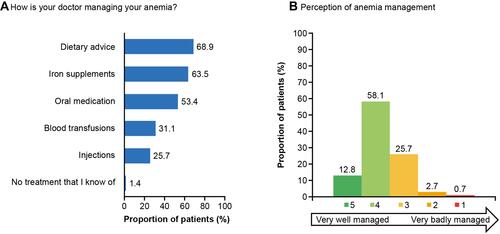
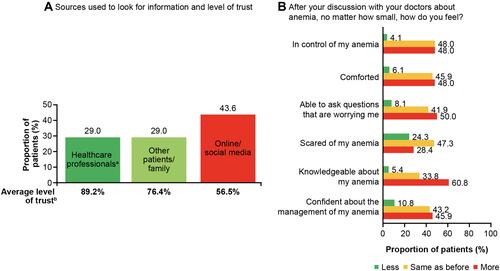
Figure 7 Information sources and level of trust (A) and feelings after conversions with healthcare providers (B) (anemia cohort, n=148). aIncludes nephrologist, hematologist, cardiologist, another specialist, family doctor, nurse/clinic staff, or pharmacist. bAverage percentage of patients who rated their level of trust in the information sources as either a 5 or 4 on a scale of 1–5, where 5 is “completely” and 1 is “not at all”.