Figures & data
Table 1 Baseline clinical characteristics by staging of CKD in total population (n = 397)
Figure 1 Staging and variation in CKD staging for patients over the four visits. (A) Staging of CKD in patients over the four visits. (B) Change in CKD staging (relative to baseline) over the four visits.
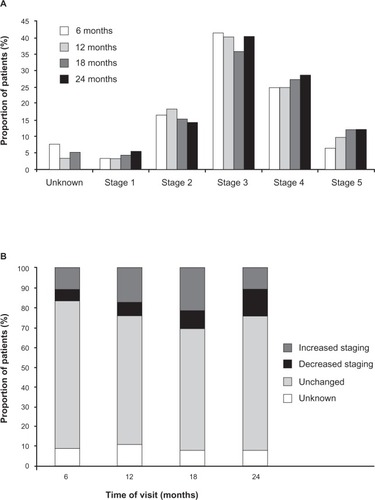
Figure 2 Concomitant diseases diagnosed in patients over the four visits.
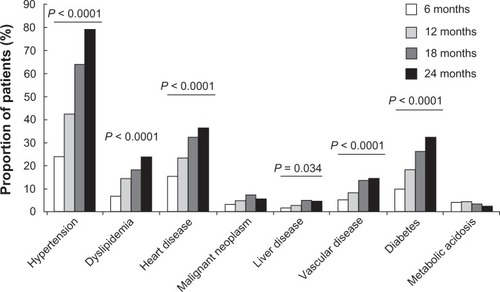
Figure 3 Treatment and adverse events in patients over the four visits. (A) Medication received in patients over the four visits. (B) Adverse events reported in patients over the four visits.
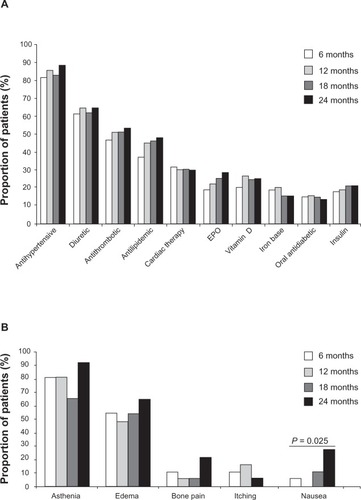
Table 2 Clinical characteristics for patients that attended four visits
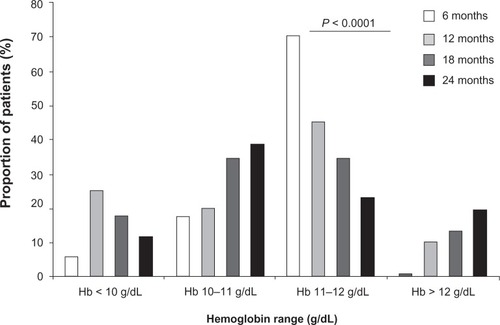
Table 3 Range in hemoglobin levels in patients over the four visits
Figure 4 Use of EPO to treat anemia in patients over the four visits. Proportion of patients receiving EPO medication by different levels of Hb over the four visits.
Abbreviations: EPO, erythropoietin; Hb, hemoglobin.