Figures & data
Figure 1 Flow of participants through study.
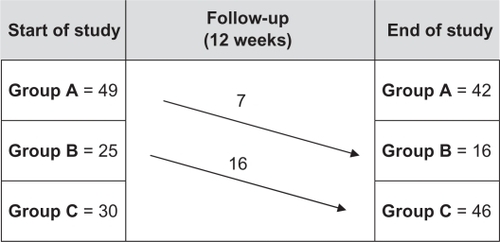
Table 1 Characteristics of the study participants (n = 104)
Table 2 Characteristics of the sample according to the symptoms of menopause (n = 104)
Table 3 Comparison of quality of life scores among middle-aged women who maintained their total habitual physical activity less than 30 minutes/day (group A), continued or began to engage in physical activity 30–60 minutes/day (group B), or continued or began to engage in physical activity for more than 60 minutes/day (group C), as assessed retrospectively after 12 weeks
Table 4 Comparison of menopause symptoms among middle-aged women who maintained their total habitual physical activity less than 30 minutes/day (group A), continued or began to engage in physical activity 30–60 minutes/day (group B), or continued or began to engage in physical activity for more than 60 minutes/day (group C), as assessed retrospectively after 12 weeks
Figure 2 Average variation in quality of life and symptoms of menopause according to the habitual practice of total physical activity (<30 minutes/day; between 30 and 60 minutes/day; >60 minutes/day) over 12 weeks. Dose-response relationship between the amount of physical activity and variations in the quality of life in the physical, psychological, and social domains and the variation in the symptoms of menopause evaluated by analysis of covariance (ANCOVA) adjusted for age, baseline body mass index, years of schooling, hormonal replacement therapy, and number of diseases, with 95% confidence intervals (physical domain P = 0.062; psychological domain P = 0.001; social domain P = 0.035; and total score of symptoms P = 0.001). Significant differences in ANCOVA tested through simple contrast.
Abbreviation: min/d, minutes per day.
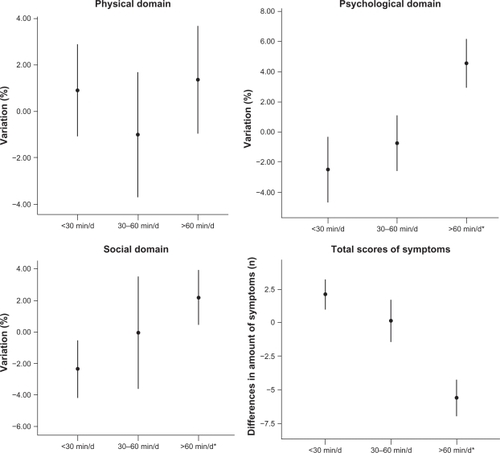
Figure 3 Average variation in the quality of life according to habitual practice of total physical activity (<30 minutes/day; between 30 and 60 minutes/day; >60 minutes/day) over 12 weeks, analyzed separately for two groups of participants: (A) those who had a decrease in menopause symptoms and (B) those whose symptoms remained constant or increased. Dose-response relationship between the amount of physical activity and variations in the quality of life in the physical, psychological, and social domains and the variation in the symptoms of menopause evaluated by analysis of covariance (ANCOVA) adjusted for age, baseline body mass index, years of schooling, hormonal replacement therapy, and number of diseases, with 95% confidence intervals. Among the women with decreased symptoms: physical domain P = 0.623; psychological domain P = 0.001; and social domain P = 0.073. Among the women without decreased symptoms: physical domain P = 0.545; psychological domain P = 0.761; and social domain P = 0.584. Significant differences in ANCOVA tested through simple contrast.
Abbreviation: min/d, minutes per day.
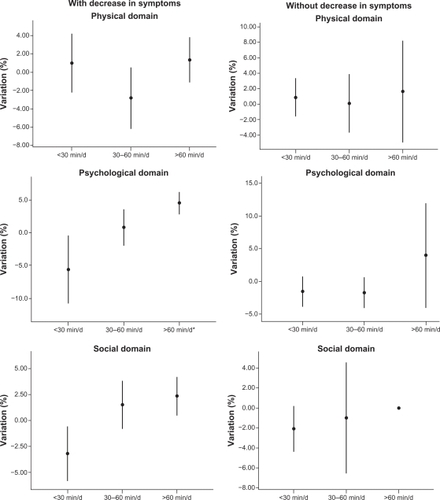
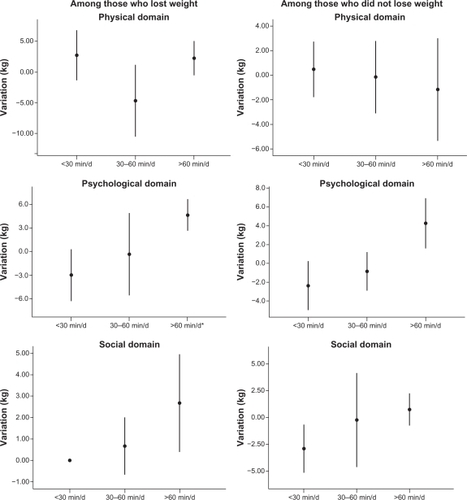
Figure 4 Average variation in quality of life according to habitual practice of total physical activity (<30 minutes/day; between 30 and 60 minutes/day; >60 minutes/day) over 12 weeks, analyzed separately for two groups of participants: (A) those who lost weight and (B) those who maintained or gained weight. Dose-response relationships between the amount of physical activity and variations in the quality of life in the physical, psychological, and social domains and variations in the symptoms of menopause evaluated by analysis of covariance (ANCOVA) adjusted for age, baseline body mass index, years of schooling, hormonal replacement therapy, and number of diseases, with 95% confidence intervals. Among those who lost weight: physical domain P = 0.698 and psychological domain P = 0.009; (B) <30 minutes/day = −3 ± 1; 30–60 minutes/day = 0.7 ± 2; >60 minutes/day = 0.1 ± 2; P = 0.082; social domain P = 0.051. Among those who did not lose weight: physical domain P = 0.960; psychological domain P = 0.082; and social domain P = 0.212. Significant differences in ANCOVA tested through simple contrast.
Abbreviation: min/d, minutes per day.