Figures & data
Figure 1 Recruitment of the survey participants.
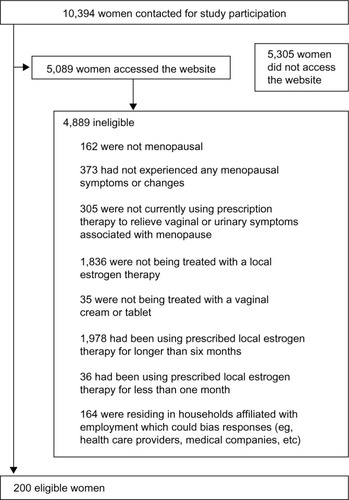
Table 1 Characteristics of the survey participants
Figure 2 Symptoms of vaginal atrophy after menopause reported by the survey participants.
Note: *P<0.05 for cream users versus tablet users.
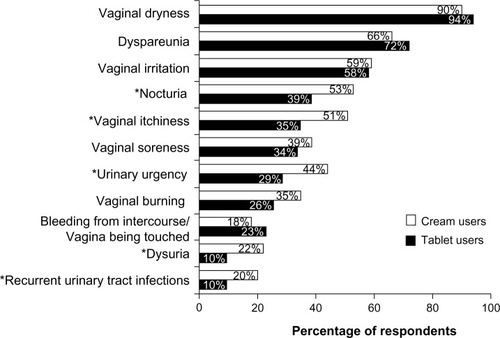
Figure 3 Mean application time for vaginal therapy.
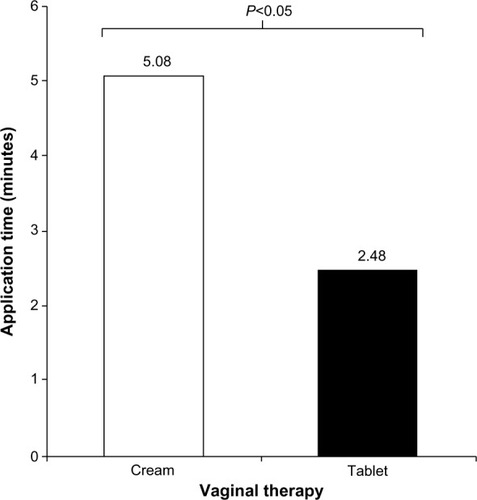
Figure 4 Percentages of women who overdose (A) or underdose (B) when applying their cream medication.
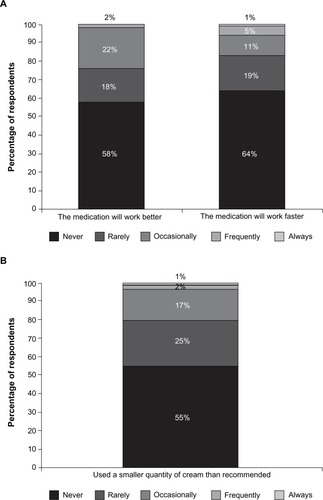
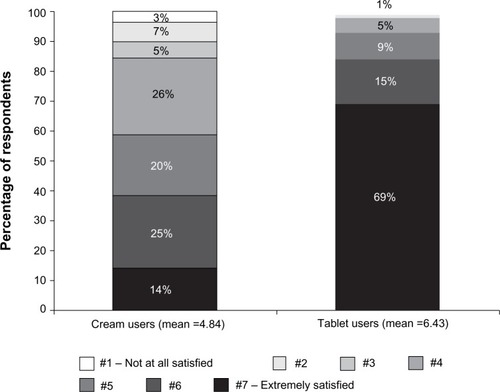
Figure 5 Overall satisfaction with treatment applicator.
Notes: Means are statistically significant. P-value for difference in means between tablet user group and cream user group is <0.05. A 7-point Likert Scale was used to evaluate patient satisfaction.