Figures & data
Figure 1 Pie chart representation of study recruitment shows approximately equal proportions of pre-eclamptic patients and normotensive subjects.
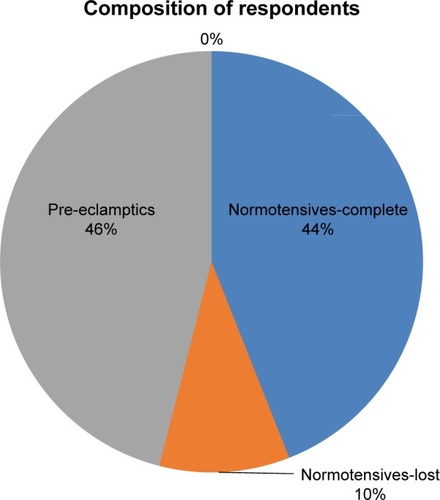
Table 1 Characteristics of normal patients at the time of OAD scan
Table 2 Characteristics of pre-eclamptic patients
Figure 2 Bar chart representation of the mean values of clinicodemographic characteristics of the normotensive and pre-eclamptic participants in the study. Note the similarity in the maternal and gestational ages of the pre-eclamptic patients and the normotensive patients.
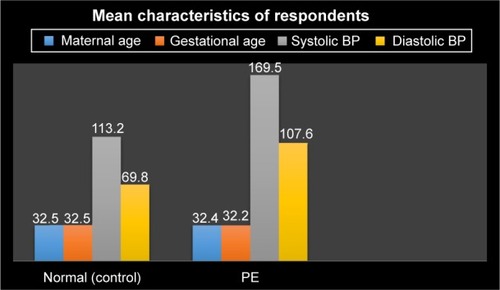
Table 3 Comparison of mean values of OAD parameters between the pre-eclamptic group and follow-up control group
Figure 3 Box plots for right RI, PI, PR, and EDV in control subjects at GA of 23±2 weeks (n=50), control subjects at GA of 32±2 weeks (n=41) and pre-eclamptic patients (n=42). (A) Box plots for right RI showing a positively skewed distribution in pre-eclamptics. Note that pre-eclamptic patients have lower RI values. (B) Box plots for the right PI showing a normal distribution in all the groups. Note that pre-eclamptic patients have lower PI values. (C) Box plots for the right PR showing a positively skewed distribution in control subjects. Note that pre-eclamptic patients have higher PR values. (D) Box plots for right EDV. A positively skewed distribution is shown in the control subjects.
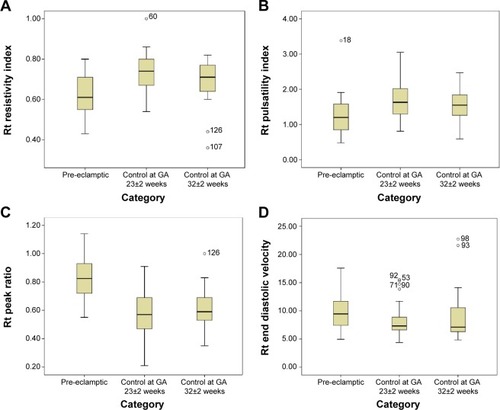
Figure 4 Box plots of MAP, RI, and PI among the pre-eclamptic subjects (mild pre-eclampsia [n=24], severe pre-eclampsia [n=18]). (A) Box plots for mean arterial pressure in those with mild pre-eclampsia and in those with severe pre-eclampsia. (B) Box plots for right RI among those with mild pre-eclampsia and those with severe pre-eclampsia. (C) Box plots for right PI among those with mild pre-eclampsia and those with severe pre-eclampsia.
![Figure 4 Box plots of MAP, RI, and PI among the pre-eclamptic subjects (mild pre-eclampsia [n=24], severe pre-eclampsia [n=18]). (A) Box plots for mean arterial pressure in those with mild pre-eclampsia and in those with severe pre-eclampsia. (B) Box plots for right RI among those with mild pre-eclampsia and those with severe pre-eclampsia. (C) Box plots for right PI among those with mild pre-eclampsia and those with severe pre-eclampsia.](/cms/asset/123d5162-b05e-4e5e-82fb-e5fe40aa8fa8/djwh_a_86314_f0004_c.jpg)
Table 4 Comparison of BP and OAD metrics between patients with mild and severe pre-eclampsia
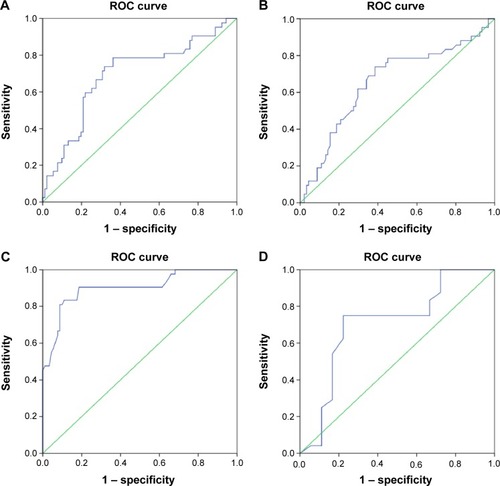
Figure 5 ROC curves for OAD parameters to predict pre-eclampsia and its severity. (A) ROC curve for PDV to predict pre-eclampsia (AUC 0.69; 95% CI 0.59–0.79). (B) ROC curve for EDV to predict pre-eclampsia (AUC 0.657; 95% CI 0.55–0.76). (C) ROC curve for PR to predict pre-eclampsia (AUC 0.900; 95% CI 0.84–0.96). (D) ROC curve for RI to predict mild pre-eclampsia (AUC 0.709; 95% CI 0.54–0.88).