
Figures & data
Table 1 Inclusion and exclusion criteria
Table 2 Main demographic data, clinical characteristics and lung function parameters of patients
Table 3 Comorbidities of study participants (data are presented as numbers and percentages)
Figure 1 Proportion of patients with different levels of asthma control according to GINA guideline.
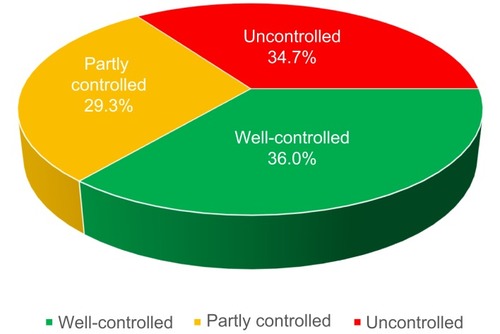
Table 4 Frequency of risk factors, control levels of affected patients, and relationship between the risk factor and uncontrolled status (Fisher’s exact test odds ratio)
Figure 2 The frequency of specific risk factors and the odds ratio of its relationship with uncontrolled status.
Abbreviations: BMI, body mass index; ICS, ICS, inhaled corticosteroid; OCS, oral corticosteroid; FEV1, forced expiratory volume in 1s; SABA, short-acting beta agonist.
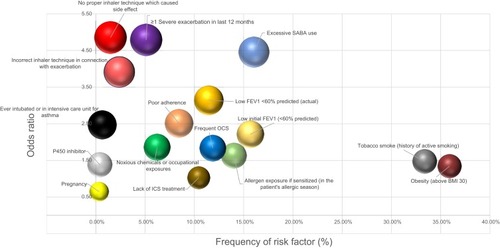
Figure S1 Risk factors for exacerbation.
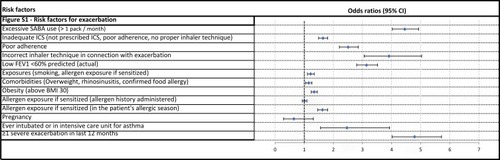
Figure S2 Risk factors for developing fixed airflow limitation.
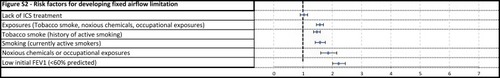
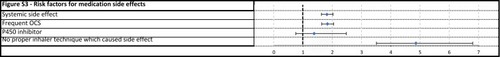
Figure S3 Risk factors for medication side effects.
Availability of data and materials
The datasets used and/or analyzed during the current study are available from the corresponding author on reasonable request.