Figures & data
Figure 1 Viability of K-562 cells after incubation (24 h) with different concentrations of the PRBC supernatants in the absence or presence of cisPt (10 µM) evaluated using the CCK-8 assay. The figure shows mean values from 5 independent experiments (A and B) and 10 independent measurements for (C). All data is presented as a percentage of control (untreated cells - assumed as 100%). Error bars denote ± SD; #p<0.05 vs control with cisPt, **p<0.01 vs control (untreated cells), ##p<0.01 vs control with cisPt, ***/###p<0.001 compared to the appropriate control.
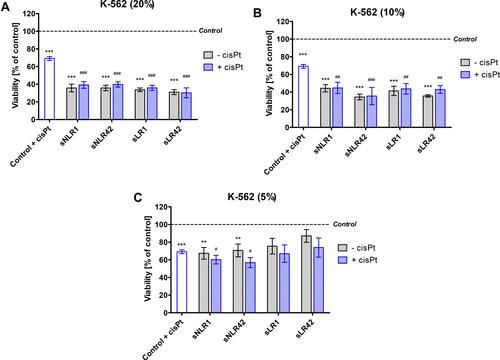
Figure 2 Proliferation of K-562 cells, assessed by the BrdU incorporation during DNA synthesis, after incubation (24 h) with the PRBC supernatants (5%) in the absence or presence of cisPt (10 µM). All data is presented as a percentage of control (untreated cells - assumed as 100%). Error bars denote ± SD, n = 3 (independent experiments); *p<0.05 vs control (untreated cells), ##p<0.01 vs control with cisPt, ***p<0.001 vs control (untreated cells).
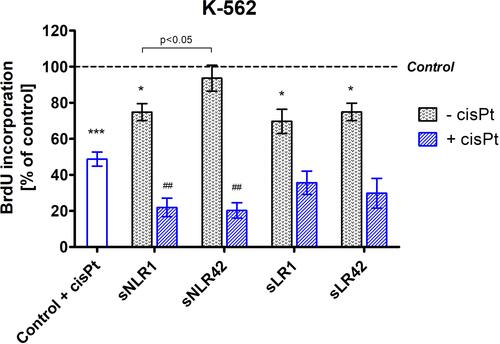
Figure 3 The intracellular ROS level in K-562 cells after incubation (60 min, 37°C) with the PRBC supernatants (5%) in the absence or presence of cisPt (10 µM). All data is presented as a percentage of control (untreated cells - assumed as 100%). Error bars denote ± SD, n = 3–5 (independent experiments); */#p<0.05 compared to the appropriate control, **p<0.01 vs control (untreated cells).
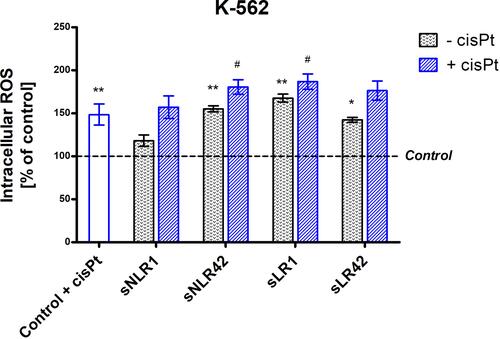
Figure 4 The DNA damage, measured as a percentage of tail DNA in the alkaline comet assay, in K-562 cells pre-incubated for 1 h at 37°C with the PRBC supernatants (5% and 20% v/v). All experiments included a negative (untreated cells) and positive (10 µM H2O2) control. Error bars denote ± SD, n = 3 (independent experiments); **p<0.01, ***p<0.001 compared to untreated cells.
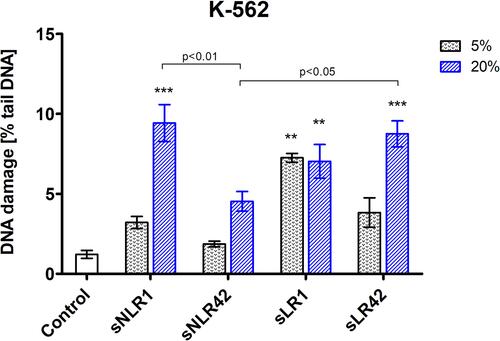
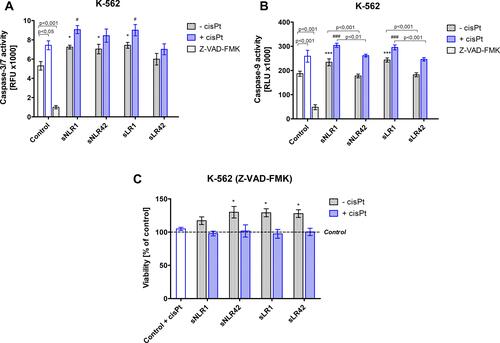
Figure 5 Activities of caspase-3/7 (A) and caspase-9 (B) in K-562 cells treated (24 h) with the PRBC supernatants (5%) in the absence or presence of cisPt (10 µM). (C) shows K-562 cells viability in the presence of caspase inhibitor Z-VAD-FMK, PRBC supernatants, and cisPt. Data obtained from viability measurements are presented as a percentage of control (untreated cells - assumed as 100%). Error bars denote ± SD, n = 3 (independent experiments); */#p<0.05, ***/###p<0.001 compared to the appropriate control.