Figures & data
Figure 1 Inhibitory effects of different brands of cranberry juice, coded A–E, on the 7-hydroxylation of S-warfarin in human liver microsomes. Human liver microsomes (0.1 mg/mL) were incubated with S-warfarin (4 μM) and juice (0.05, 0.20, 0.50%, v/v) for 30 minutes. Reactions were initiated by the addition of NADPH (1 mM). S-warfarin 7-hydroxylation activity in the presence of vehicle control (water) was 5.7 ± 0.4 pmol/min/mg microsomal protein. Bars and error bars denote means and standard deviations, respectively, of triplicate incubations. *P < 0.05 versus 0.05% juice; #P < 0.05 versus 0.20% juice (one-way ANOVA, followed by Tukey’s test).
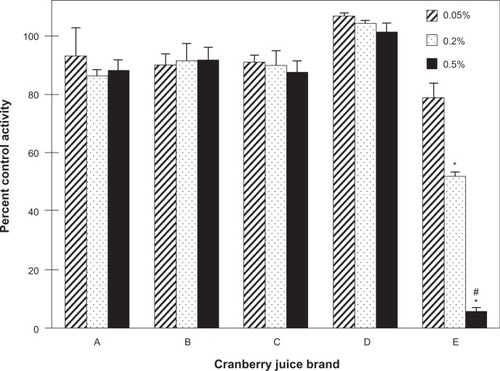
Figure 2 Inhibitory effects of the various fractions generated from the cranberry juice obtained from vendor A (A), B (B), C (C), D (D) and E (E) on the 7-hydroxylation of S-warfarin in human liver microsomes. Human liver microsomes (0.1 mg/mL) were incubated with S-warfarin (4 μM) and juice fraction (10 or 50 μg/mL) for 30 minutes. Reactions were initiated by the addition of NADPH (1 mM). S-warfarin 7-hydroxylation activity in the presence of vehicle control (1% methanol) was 2.3 ± 0.1 pmol/min/mg microsomal protein. Bars and error bars denote means and standard deviations, respectively, of triplicate incubations. *P < 0.05 versus 10 μg/mL; †P < 0.05 versus all other fractions at 10 μg/mL; ‡P < 0.05 versus all other fractions at 50 μg/mL (two-way ANOVA, followed by Tukey’s test).
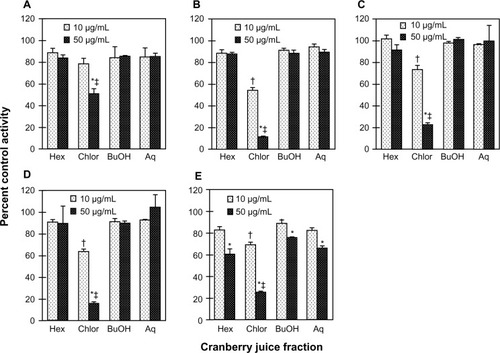
Figure 3 Geometric mean concentration-time profile (0–96 hours) of S-warfarin (A) and R-warfarin (B) for 16 healthy volunteers given three × 240 mL glasses of water or sweetened double-strength cranberry juice (CBJ) E and a single oral dose of warfarin (10 mg). Insets depict the 0–12-hour time profiles. Symbols and error bars denote geometric means and upper limits of the 90% confidence interval, respectively.
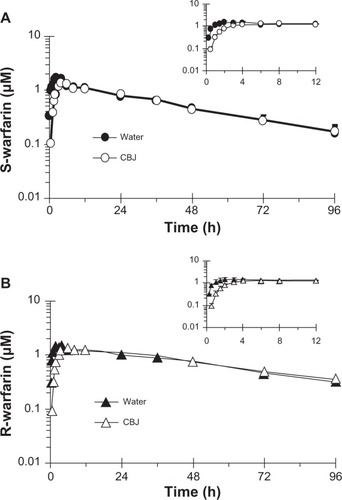
Figure 4 Effects of three × 240 mL glasses of water and sweetened double-strength cranberry juice (CBJ) E on the AUC0–∞ (A) and terminal half-life (B) of S-warfarin in each of 16 healthy volunteers given a single oral dose of warfarin (10 mg). Open symbols connected by solid lines denote individual values. Filled symbols connected by dashed lines denote geometric mean values.
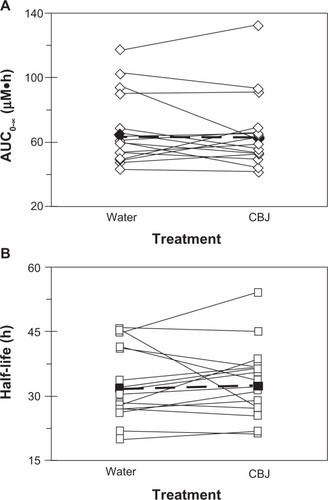
Table 1 Pharmacokinetics of S- and R-warfarin in 16 healthy volunteers given a single oral dose of warfarin (10 mg) with water or sweetened double-strength cranberry juice from vendor E (3 × 240 mL glasses).