Figures & data
Table 1 Clinical details of CTB patients
Figure 1 Cutaneous tuberculosis affected patients.
Notes: Lupus vulgaris shows keratotic plaques on back (A) and left knee (B). Lupus vulgaris shows keratotic plaque on left hand (C). Lupus vulgaris and scrofuloderma shows left cervical scrofuloderma and preauricular erythematous plaque (D).
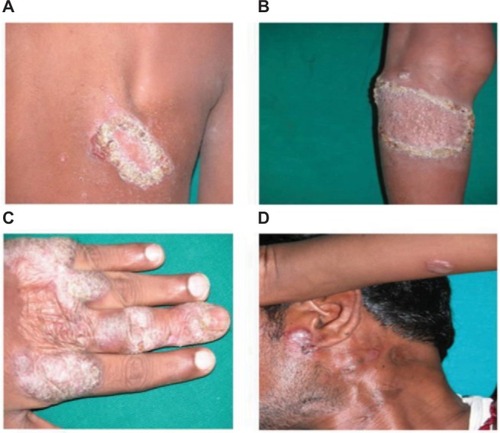
Figure 2 IL-17A producing cells and gene expression in CTB patients.
Notes: (A) Dot plot of flow cytometry showing CD3+CD4+ gating strategy and histogram depicting IL-17+cells in CTB and HC group, respectively. (B) Scatter diagram shows mean% ± SD of CD3+CD4+IL-17+, Th17 cells in CTB patients and HC. (C) Scatter diagram of gene expression (mean% ΔCt ± SD) of skin biopsies showed decrease in expression of IL-17 in CTB patients’ skin as compared to HC skin. Figures in parenthesis indicate number of subjects studied. P<0.05 was considered significant by 2 tailed Mann–Whitney test.
Abbreviations: ΔCt, threshold cycle (delta Ct) of real time PCR; CTB, cutaneous tuberculosis; HC, healthy controls.
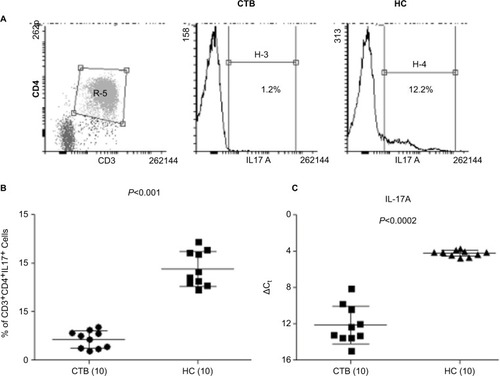
Figure 3 High in situ expression of Treg cells in CTB.
Notes: IHC on representative skin lesions from (A and B) CTB patients and (C and D) healthy skin controls data. (A and C) showing detailed nuclear staining of FOXP3+ cells and (B and D) showing TGF-β+ cytoplasmic staining in skin tuberculosis and healthy skin. (E and F) Scatter diagram shows percentage of positive cells/1,000 cells. DAB was used as chromogen after treatment with appropriate anti-human FOXP3 and TGF-β antibody; details given in “Materials and Methods” section. Scatter diagram shows increase of cells with FOXP3 and TGF-β in CTB as compared to HC patients. horizontal and vertical bars indicate mean% ± SD of positive cells of 1,000 total cells. P<0.05 was considered as a significant value by 2-tailed Mann–Whitney test. Figures in parenthesis indicate the number of subjects. Arrows show FOXP3 and TGF-β positive cells.
Abbreviations: CTB, cutaneous tuberculosis; HC, healthy controls.
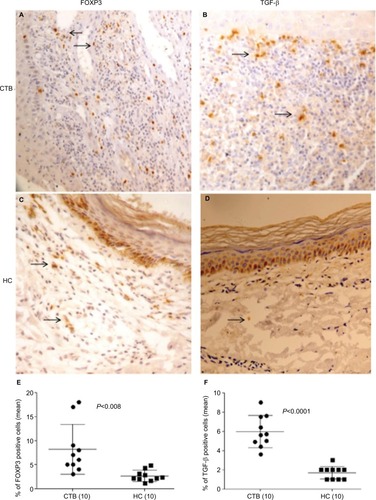
Figure 4 Upregulated Treg cells and intracellular TGF-β cells in CTB patients.
Notes: (A and B) Dot plots of flow cytometry shows cD3+cD4+-gated cD25+FOXP3+ Treg cells and histogram shows intracellular TGF-β in CTB and HS group, respectively. (C) Scatter diagram is represented as mean% ± AD of Treg cells in CTB patients and HS. (D) Scatter diagram of mean% ΔCt ± SD demonstrating significantly upregulated intracellular TGF-β in CTB patients as compared to HS. Figures in parenthesis indicate number of subjects studied. P<0.05 was considered as a significant value by 2-tailed Mann–Whitney test.
Abbreviations: ΔCt, threshold cycle (delta Ct) of real time PCR; CTB, cutaneous tuberculosis; HC, healthy controls; HS, healthy skin controls data.
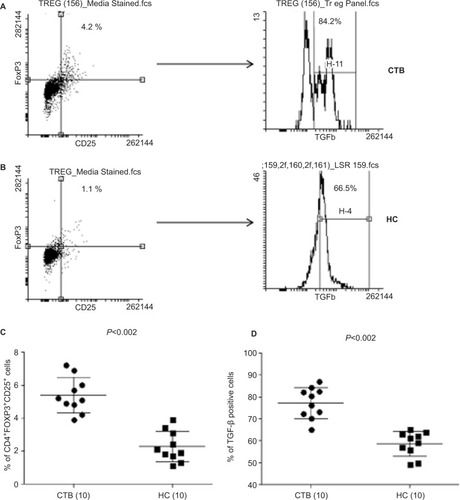
Figure 5 FOXP3 and TGF-β gene expression in CTB.
Notes: scatter diagram of gene expression (mean% ΔCt ± SD) of skin biopsies showed increase in expression of (A) FOXP3 and (B) TGF-β in CTB patients’ skin as compared to HS. Figures in parenthesis indicate number of subjects studied. P<0.05 was considered as a significant value by 2-tailed Mann–Whitney test and spearman test for correlation.
Abbreviations: ΔCt, threshold cycle (delta Ct) of real time PCR; CTB, cutaneous tuberculosis; HC, healthy controls; HS, healthy skin controls data.
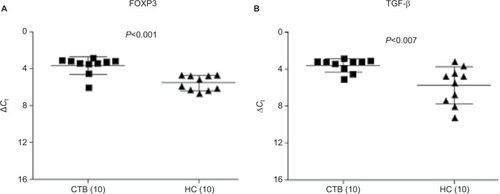
Figure 6 Correlation of gene expression.
Notes: This figure shows significant correlation of FOXP3 and TGF-β gene expression in skin of CTB patients. Figures in parenthesis indicate number of subjects studied. P<0.05 was considered as a significant value by 2-tailed Mann– Whitney test and spearman test for correlation.
Abbreviations: ΔCt, threshold cycle (delta Ct) of real time PCR; CTB, cutaneous tuberculosis.
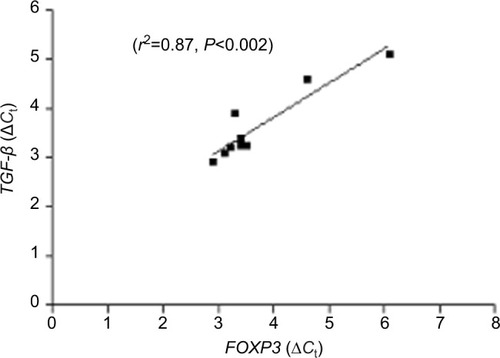
Figure S1 Flow cytometry dot plot are showing gating strategy and unstimulated and PHA control for Th17 cells.
Abbreviation: PHA, phytohemagglutinin.
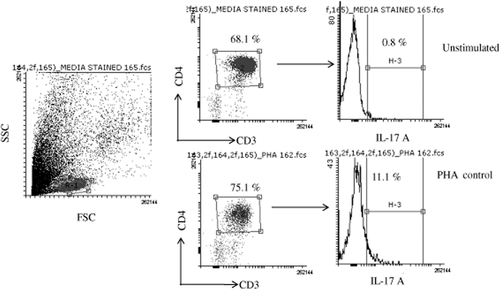
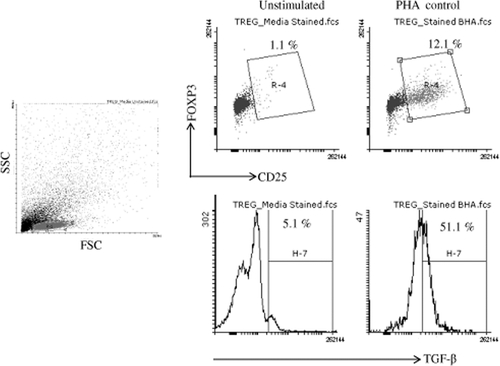
Figure S2 Flow cytometry dot plot are showing gating strategy and unstimulated and PHA control for TGF-β producing Treg cells.
Abbreviation: PHA, phytohemagglutinin.