Figures & data
Figure 1 LG4 treatment improved renal function in T1DM mice. (A) Chemical structure of LG4. (B and C) Type I diabetes mellitus mice (T1DM) were orally administrated with vehicle (Veh) or LG4 (5, 10 mg/kg, every other day) from week 8 to week 18. Blood glucose and body weight were measured every other week. (D–F) Blood Urea Nitrogen (BUN), Urine Albumin Creatinine Ratio (UACR), and serum creatinine (SCR) of each group were determined at 18th week. **p < 0.01; ***p < 0.001 vs Ctrl; #p < 0.05, ##p < 0.01 vs T1DM, n = 5.
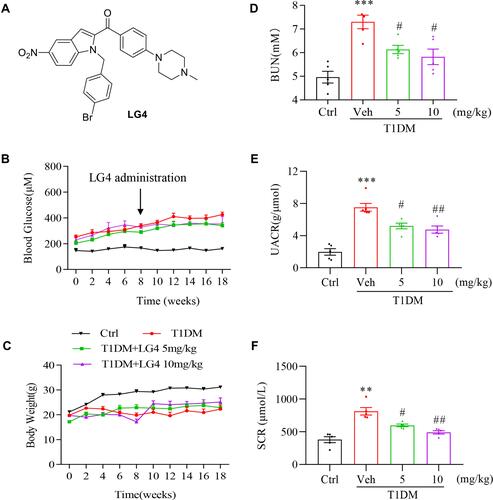
Figure 2 LG4 attenuates renal fibrosis in T1DM mice. (A) Kidney tissue sections were from the control, T1DM, and T1DM+LG4 mice. Representative images of H&E staining (200× magnification), Masson’s staining (200× magnification), and anti-COL-4 immunofluorescence staining (green, 400× magnification) were shown. (B and C) Quantitative date of the Masson’s (expressed as percentage of positive area) and COL–4 staining (expressed as relative fluorescence intensity). (D) Glomerular sclerosis score (0–4) was determined and plotted. (E and F) Western blot showed COL-4 and TGF-β levels in the kidney tissues, and relative protein levels to GAPDH were shown. ***p < 0.001 vs Ctrl; ##p < 0.01, ###p < 0.001 vs T1DM, n = 5.
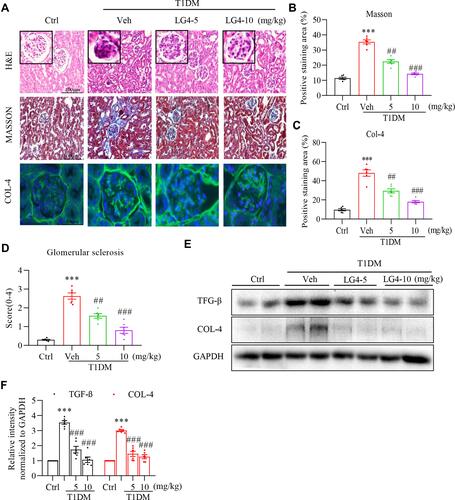
Figure 3 LG4 treatment inhibits renal inflammation in T1DM mice. (A and B) Representative images and quantitation of immunohistochemistry staining against TNF-α in the kidneys (200×). A typical view of glomerulus was selected and showed. (C and D) Real-time qPCR analyzed gene expression levels of Tnf-α and Il-6 in the kidneys. (E and F) Western blot assay detected p-IκBα and IκBα level in the kidneys. Relative densitometric quantification to GAPDH was shown. *p < 0.05, **p < 0.01, ***p < 0.001, T1DM vs control (Ctrl); #p < 0.05, ##p < 0.01, ###p < 0.001, T1DM + LG4 vs Veh, n =5.
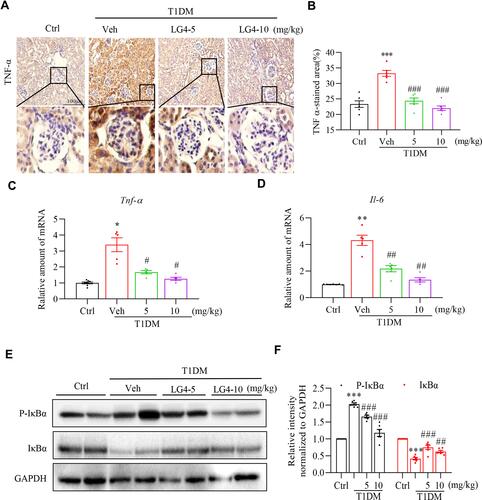
Figure 4 LG4 directly binding to proteins of MAPK pathways. (A) Chemical structure of biotin-labelled LG4. (B) Schematic showing the main steps for biotin or LG4-biotin using HuProtTM microarray. (C) Pathway enrichment of the differential binding proteins (fold enrichment ≥2 and p value < 0.05) were listed. (D) Representative image of the microarray showing positive (red arrow), negative (blue arrow) and MAPK10 (yellow arrow) spots. The table showed the magnified images of LG4-biotin binding to MAPKs spots and signal-to-noise ratios (SNR).
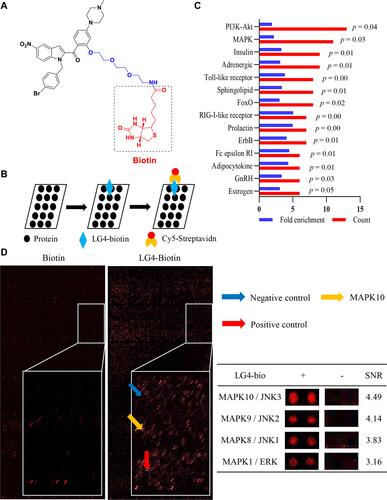
Figure 5 LG4 inhibits the activation of JNK and ERK in vivo and in vitro. (A and B) SV40MES13 cells were pretreated with LG4 (2.5 and 5 μM) for 1 h and incubated with HG (33 mM) for 2 h. Cells were harvested and processed for phosphorylated JNK and ERK detection by Western blot. GAPDH, total JNK and ERK were used as loading controls. Corresponding densitometric quantifications were shown. (C and D) Western blots detected p-JNK and p-ERK levels in the kidneys. Corresponding densitometric quantifications were shown. ***p < 0.001 vs Ctrl; ###p < 0.001 vs HG or Veh.
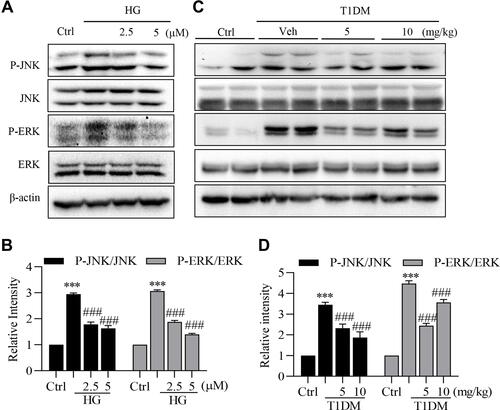
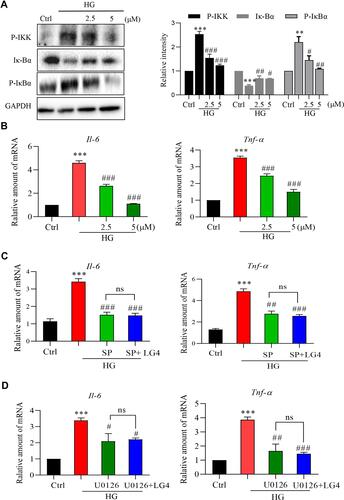
Figure 6 LG4 inhibits high glucose-induced inflammation via targeting JNK and ERK pathways. (A) SV40MES13 cells were pretreated with LG4 (2.5 and 5μM) for 1 h and incubated with HG (33 mM) for 2 h. Cells were harvested for p-IKK and Iκ-Bα analysis with Western blot. Corresponding densitometric quantifications were shown. (B) SV40MES13 cells were pretreated with LG4 (2.5 and 5 μM) for 1 h and incubated with HG (33 mM) for 8 h. Gene expression levels of Tnfa and Il6 were analyzed with real-time qPCR. (C and D) SV40MES13 cells were pretreated with LG4 (5 μM) with/without SP600125 (10 μM) or U0126 (10 μM) for 1 h, followed by incubation with 33 mmol/L HG for 8 h. Gene expression levels of Tnfa and Il6 were examined by RT-qPCR. Data were normalized by β-Actin level. **p < 0.01; ***p < 0.001 vs Ctrl. #p<0.05, ##p<0.01, ###p<0.001 vs HG, ns: no significant difference.