Figures & data
Table 1 For qRT-PCR Study of Primer
Table 2 Mankin Score (Histological Evaluation)
Figure 1 Effects of IGF-1 on Chondrocytes during the development of OA induced by IL-1β 10 ng/mL, (A) immunohistochemistry staining for the existence of MMP-1 in vitro (× 200, Scale bar = 200 μm), (B) Real-time PCR on mRNA for MMP-13, MMP-3, MMP-1 and TIMP-1, and (C) quantitative histogram of ROS production. Here, N/C= Normal control, IL-1β = 10 ng/mL IL-1β, 10 IGF-1= 10 ng/mL IGF-1, 30 IGF-1= 30 ng/mL IGF-1, 100 IGF-1= 100 ng/mL IGF-1, and 50 Diclofenac= 50 μg/mL Diclofenac. Values are the mean ± SD. *p < 0.05, and **p < 0.01.
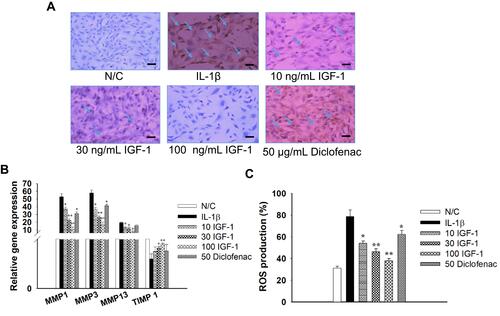
Figure 2 Effects of IGF-1 on primary chondrocytes during IL-1β stimulated specific signaling pathways, (A) Western blotting for the expression of p-P38/P38, p-Akt/Akt, P-p65/NF-κB and (B) quantitative histogram in vitro. Values are the mean ± SD. *p < 0.05, and **p < 0.01.
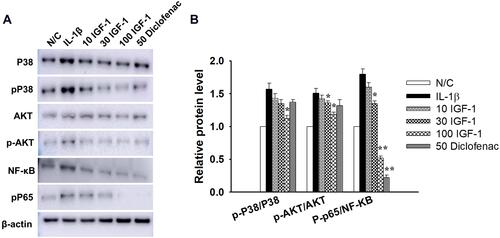
Figure 3 Effects of IGF-1 on IL-1β stimulated apoptosis in monolayer Chondrocytes in gene level of (A) TNF-α, (B) Caspase 3 and (C) Bax gene expression in vitro. Values are the mean ± SD. *p < 0.05, and **p < 0.01.
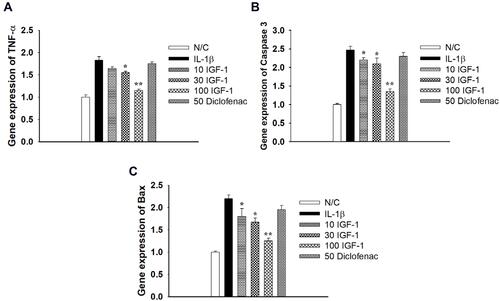
Figure 4 Effects of IGF-1 on (A) macroscopic pictures and (B) macroscopic scores of rabbit’s femoral condyles from cartilage damage after treatment with IGF-1 at 4 and 8 weeks and (C) quantitative histogram of ROS production in femoral condyles at 4 and 8 weeks in vivo. The Red arrow indicated articular cartilage destruction and the green arrow indicated reconstruction of femoral condyle surface by formation of new fibrous tissue. Here, N/C= Normal control, 0.1 IGF-1= 100 ng/mL IGF-1, 0.3 IGF-1= 300 ng/mL IGF-1, 1.0 IGF-1= 1 µg/mL IGF-1, and 5 Diclofenac= 5 mg/mL Diclofenac. Values are the mean ± SD. *p < 0.05, and **p < 0.01.
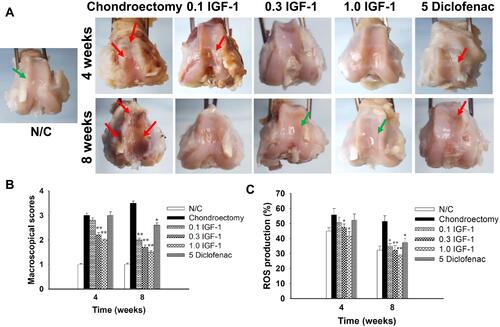
Figure 5 Effects of IGF-1 on genes level of MMP-13, MMP-3, MMP-1 and TIMP-1 in rabbit’s articular cartilage at (A) 4 weeks, (B) 8 weeks after treatment and (C) TNF-α, (D) Caspase 3, and (E) Bax gene expression in vivo by real–time PCR. Values are the mean ± SD. *p < 0.05, and **p < 0.01.
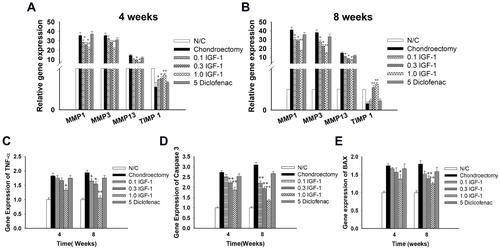
Figure 6 Effects of IGF-1 on MAPKs, P13K/Akt, NF-κB signaling pathways on rabbit’s femoral condyles during cartilage damage (A) Western blotting for the expression of p-P38/P38, p-Akt/Akt, P-p65/NF-κB and quantitative histogram (B), (C) and (D) in vivo. Values are the mean ± SD. *p < 0.05, and **p < 0.01.
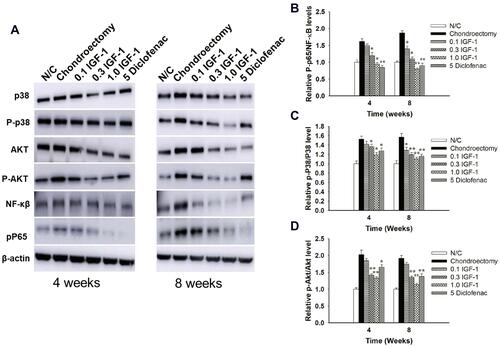
Figure 7 Effects of IGF-1 on (A) hematoxylin-eosin staining (B) safranin O (C) masson’s trichrome staining for the existence of the cartilage during the OA in rabbit femoral condyle after treatment of at 4 and 8 weeks and (D) immunohistochemistry staining for the existence of MMP-1 in the cartilage at 4 and 8 weeks in vivo (× 200, scale bar = 200 μm). Yellow arrow indicated chondrocyte cell and blue arrow indicated erosion of condyle and positive MMP-1 (IHC).
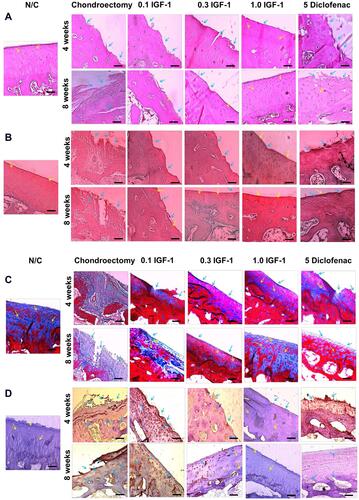
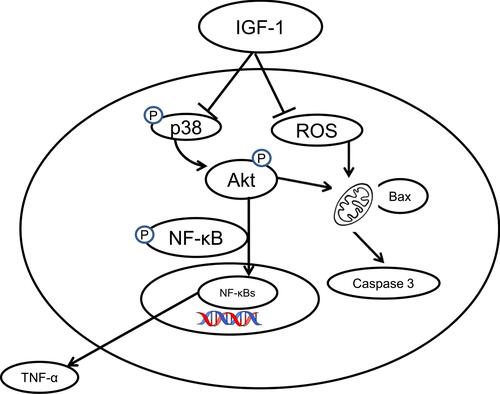
Figure 8 An overall schematic diagram of this study clearly indicates that IGF-1 inhibits osteoarthritis activity via the PI3K/Akt, NF- κB, and MAPK signaling pathways. (┤ indicate inhibitory pathways, → indicate stimulatory pathways).