Figures & data
Figure 1 Gene expression of Wnt16, Tnfsf11 and Tnfrsf11b following stimulation with gp130 cytokines. Primary calvarial osteoblast cultures were treated with cytokines in the gp130 family (100 ng/mL). The expression of Wnt16 (A), Tnfsf11 (B) and Tnfrsf11b (C) was analyzed after 24h. Individual values are presented in all graphs with the mean shown as horizontal lines and ±SEM as vertical lines. ***P<0.001, *P < 0.05 vs control (CTRL), one-way ANOVA followed by Dunnett’s multiple comparison test.
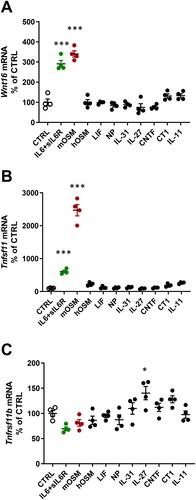
Figure 2 OSM and IL-6 time-and dose-dependently increase the expression of Wnt16 and Tnfsf11. Primary calvarial osteoblast cultures were treated with mOSM (A–C) or with IL-6 (D–F) together with sIL-6R. Expression of Wnt16 (A and D) and Tnfsf11 (B and E) was analyzed after stimulation with 100 ng/mL mOSM (A and B) or 100 ng/mL IL-6 together with 100 ng/mL sIL-6R (D and E) for 3, 6, 24 and 48 h. Expression of Wnt16 24h after addition of mOSM (0.1–100 ng/mL) (C) or IL-6 (0.1–100 ng/mL) together with sIL-6R (100 ng/mL) (F) for 24h. Individual values are presented in all graphs with the mean shown as horizontal lines and ±SEM as vertical lines. ***P<0.001, **P < 0.01, *P < 0.05 vs untreated control (CTRL) at each time point, Student’s t-test. ###P<0.001, #P < 0.05 vs control, one-way ANOVA followed by Dunnett’s multiple comparison test.
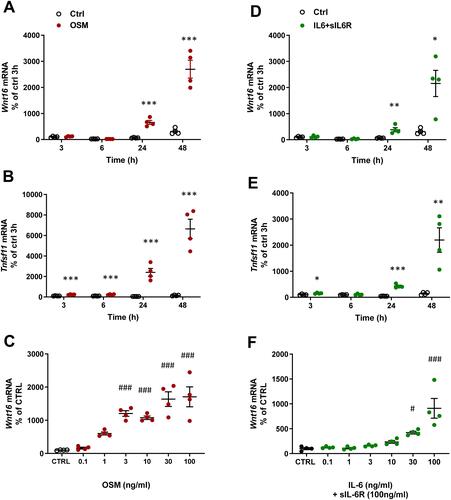
Figure 3 Recombinant exogenous WNT16 inhibits osteoclastogenesis in primary calvarial bone cell cultures and in spleen cell cultures. Primary calvarial bone cells were stimulated with mOSM (30 ng/mL) in the presence or absence of WNT16 (1 µg/mL) for 9 days. Cells were TRAP stained (A) and number of TRAP+MuOCL with more than 3 nuclei (B) was analyzed. Scale bars, 500 µm. Gene expression of Acp5 (C), Calcr (D), Tnfs11 (E) and Tnfrs11b (F). Primary spleen cell cultures were stimulated with 4 ng/mL RANKL in the presence or absence of 1 µg/mL WNT16 for 4 days. Cells were TRAP stained (G) and number of TRAP+MuOCL with more than 3 nuclei (H) was analyzed. Scale bars, 200 µm. Gene expression of Acp5 (I) and Calcr (J). Individual values are presented in all graphs with the mean shown as horizontal lines and ±SEM as vertical lines. ***P<0.001, *P < 0.05 vs mOSM or mRANKL-treated cells, Student’s t-test.
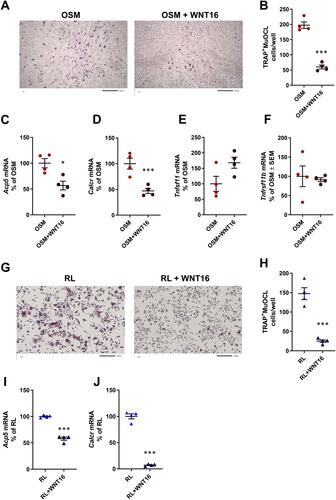
Figure 4 Osteoclastogenesis stimulated by OSM is enhanced in primary calvarial bone cell cultures from Wnt16−/- mice. Primary calvarial periosteal cells from wild-type (WT) and Wnt16−/- mice were stimulated with 100 ng/mL mOSM for 11 days. Cells were TRAP stained (A) and numbers of TRAP+MuOCL with more than 3 (B) and 10 nuclei (C) as well as the total surface (D) covered by TRAP+MuOCL were analyzed. Scale bars, 500 µm. Expression of Acp5 (E), Ctsk (F), Tnfs11 (G) and Tnfrs11b (H) after mOSM treatment for 11 days. Individual values are presented in all graphs with the mean shown as horizontal lines and ±SEM as vertical lines. ###P<0.001, ##P < 0.01 vs WT, Student’s t-test. ***P<0.001*P < 0.05 vs genotype specific untreated control, two-way ANOVA followed by Sidak’s multiple comparison test for the effect of mOSM treatment. §§§P<0.001, ns (not significant) P>0.05 for the effect by mOSM in WT vs the effect by mOSM in Wnt16−/- cells analyzed by interaction in two-way ANOVA.
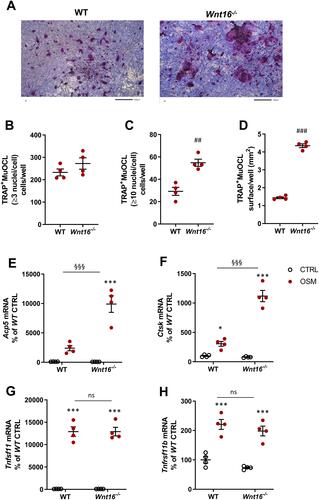
Figure 5 Osteoclastogenesis stimulated by OSM is unchanged in primary bone marrow cell cultures from Wnt16−/- mice. Primary bone marrow cell cultures from WT and Wnt16−/- mice were stimulated with 100 ng/mL mOSM for 9 days. Photos of TRAP stained cells (A), and numbers of TRAP+MuOCL with more than 3 (B) and 10 nuclei (C) as well as the total surface covered by TRAP+MuOCL (D) were analyzed. Scale bars, 200 µm. Expression of Acp5 (E), Ctsk (F), Wnt16 (G), Osmr (H) and Tnfs11 (I) after mOSM treatment for 9 days. Individual values are presented in all graphs with the mean shown as horizontal lines and ±SEM as vertical lines. ***P<0.001*P < 0.05 vs genotype specific untreated control; two-way ANOVA followed by Sidak’s multiple comparison test. ns (not significant) P>0.05 for the effect by mOSM in WT vs the effect by mOSM in Wnt16−/- cells analyzed by interaction in two-way ANOVA.
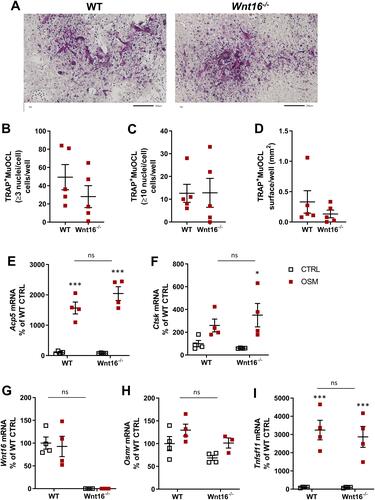
Figure 6 Expression of Wnt16 in calvarial bone cells and bone marrow cells analyzed by PCR, in situ hybridization and scRNAseq. (A) Expression of Wnt16 in three bone marrow cell (BMC) cultures and three calvarial bone cell (cOBL) cultures cultured in osteogenic media for 7 and 6–8 days, respectively. Individual values are presented with the mean shown as horizontal lines and ±SEM as vertical lines. ***P<0.001 BMC vs cOBL, two-way ANOVA. (B) RNAscope of Wnt16 expression (red) in L5 vertebrae. Scale bar, 50 µm. (C–F) Single cell RNA sequencing analysis of bone marrow stromal cells using nicheExplorer.Citation52 Reprinted with permission from Springer Nature Customer Service Centre GmbH; Springer Nature; Nature; The bone marrow microenvironment at single-cell resolution, Anastasia N. Tikhonova et al, © 2019, www.aifantislab.com/niche. (C) t-SNE visualization of endothelial (V1-2), perivascular (P1-4), osteo-lineage (O1-3) and one mitotic cell cluster (cycling) identified by Tikhovona et al.Citation52 Feature plots of Wnt16 (D), Osmr (E) and Tnfsf11 (F) expression.
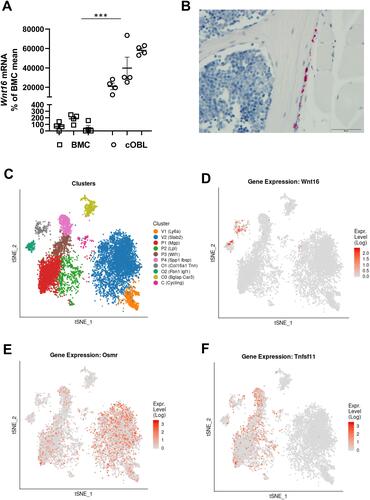
Figure 7 OSM induces Wnt16 expression through the OSMR/gp130/SHC1/STAT3 axis. The expression of Osmr (A), Lifr (B), IL6st (encoding gp130) (C), Stat3 (D), Erk (Mapk1/Mapk3) (E), and Shc1 (F) was silenced in primary calvarial osteoblast cultures using siRNA. Cells were treated with 100 ng/mL mOSM for 24 h and thereafter Wnt16 expression was analyzed. Scrambled siRNA (Scr) was used as control. Individual values are presented in all graphs with the mean shown as horizontal lines and ±SEM as vertical lines. ***P<0.001, **P < 0.01, *P < 0.05 vs respective untreated control, two-way ANOVA followed by Sidak’s multiple comparison test. §§P<0.01, §§§P<0.001, ns (not significant) P>0.05 for the effect by mOSM in siRNA-treated cells vs the effect by mOSM in Scr-treated cells analyzed by interaction in two-way ANOVA.
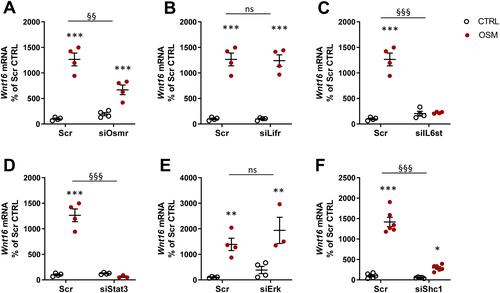
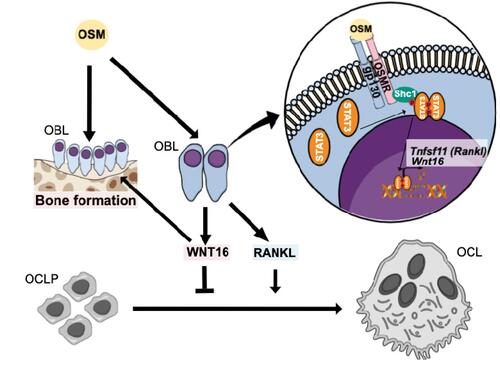
Figure 8 Proposed effects and signaling pathways by OSM in bone cells. OSM increases bone resorption by inducing the expression of osteoclastogenic RANKL by osteoblasts. We, here, show that OSM also induces the expression of WNT16 that act as a negative feedback regulator of osteoclast formation in calvarial periosteal cells. The induction of Wnt16 by OSM is dependent on gp130 and OSM receptor (OSMR), and downstream signaling by the SHC1/STAT3 pathway. The inhibition of osteoclastogenesis by WNT16, together with a stimulatory effect on bone formation by OSMCitation27,Citation31 and WNT16,Citation11,Citation70 will cause an OSM-dependent increase of bone mass.