Figures & data
Figure 1 MMP-9 regulates inflammation and permeability in LPS-treated cells. (A–D) PMVECs were treated with LPS (1μg/mL) with or without rMMP-9 (10 ng/mL) for 4 h. The mRNA levels of IL-6, CXCL-1, ICAM-1, and VCAM-1 were detected. (E) The protein levels of VCAM-1, ICAM-1 and TRAF-6 were detected by Western blot analysis in PMVECs exposed to LPS with or without rMMP-9 treatment. (F) MMP-9 protein levels were detected by immunoblotting in PMVECs exposed to LPS with or without PDTC treatment. (G) 293T cells were transfected with Cignal NF-kB dual luciferase reporter plasmids for 48 h, and then cells were treated with LPS (1μg/mL) with or without rMMP-9 (10 ng/mL) for an additional 6 h or 18 h. (H) 293T cells were co-transfected with NF-kB dual luciferase reporter plasmids along with control siRNA, or MMP-9 siRNA for 48 h, and then cells were treated with LPS (1μg/mL) for an additional 6 h or 18 h. Cells were then collected and assayed for luciferase activity to evaluate NF-kB promoter activity. (I) PMVECs were transfected with control siRNA, or MMP-9 siRNA for 48 h, and then cells were treated with LPS (1μg/mL) in a time course. Supernatant IL-6 secretion was measured by ELISA. (J) PMVECs were treated by APMA (APMA was used to active rMMP9 in vitro, and served as a control of active rMMP9) or active rMMP9 (10 ng/mL) 1 h before LPS challenged at indicated times, and then supernatant IL-6 was detected. (K and L) The permeability of treated PMVEC monolayers grown on 0.4 mm filters was determined by the appearance of rhodamine-dextran, which was added to the top well at the beginning of the experiment and detected the absorbance at 590 nm in the bottom well during a 90 min time course. *P<0.05, **P<0.01. All the results are from at least three independent experiments; Data represent means ±SEM.
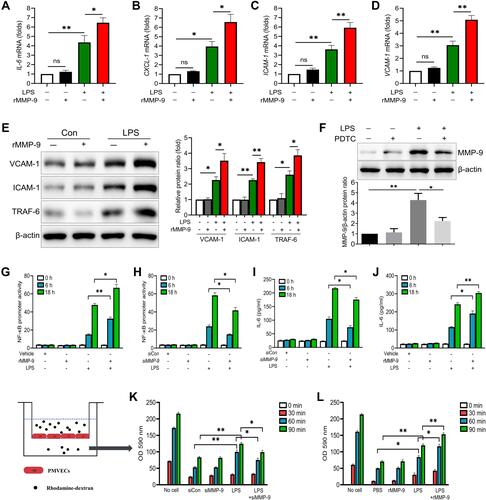
Figure 2 MMP-9 worsens LPS-induced lung injury in vivo. Mice were treated with LPS (2mg/kg, i.t.), recombinant MMP-9 (rMMP-9, 50μg/kg, i.v.), or their combination. 18 h later, bronchoalveolar lavage fluid (BALF) and lung tissues were collected. The protein concentration (A), IL-6 (B), TNF-α (C), cell counts (D), neutrophils (E) in Bronchoalveolar lavage fluid (BALF), and MPO activity (F) from the lung of mice were measured. (G) EBA uptake and (H) Hematoxylin and eosin (H&E)–stained lung sections (×200 magnification) with the injury score (I) were detected. Mice were treated by a lethal dose of LPS (20mg/kg, i.t.) with or without rMMP-9 (50μg/kg, i.v.), and then survival rates (J) were investigated. Data were analyzed by the Mantel-Cox test (survival). *P<0.05, **P<0.01, ***P<0.001, ****P<0.0001. Data represent means ±SEM.
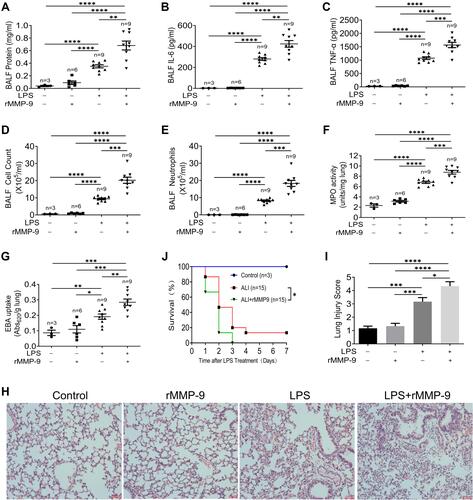
Figure 3 Integrin β3/5 regulates MMP-9 expression in LPS-treated PMVECs. (A and B) Heat map of downregulated (green) and upregulated (red) mRNAs from PMVECs transfected with Itgb3 siRNA (siItgb3) or Itgb5 siRNA (siItgb5) for 48 h, and then subjected to 18 h of LPS (1μg/mL) treatment. Numbers 1, 2, and 3 refer to three independent experimental analyses of log2[(LPS+siCon)/(LPS+siItgb3/5)]. (C and D) MMP-9 gene expressions were measured in PMVECs transfected with siItgb3/5 for 48 h prior to 18 h of LPS (1μg/mL) treatment. (E and F) Western blot analysis of MMP-9 protein levels from PMVECs transfected with control siRNA (siCon) or siItgb3/5 for 48 h prior to 18 h of PBS or LPS (1μg/mL) treatment. (G and H) Western blot analysis of MMP-9 protein levels from PMVECs transfected with Itgb3/5 plasmid in a dose course and then exposed to LPS (1μg/mL). ELISA analysis of MMP-9 secretion from PMVECs transfected with Itgb3/5 plasmid (I) or siItgb3/5 (J) and then exposed to PBS or LPS (1μg/mL). *P<0.05, **P<0.01. All the results are from at least three independent experiments; Data represent means ±SEM.
![Figure 3 Integrin β3/5 regulates MMP-9 expression in LPS-treated PMVECs. (A and B) Heat map of downregulated (green) and upregulated (red) mRNAs from PMVECs transfected with Itgb3 siRNA (siItgb3) or Itgb5 siRNA (siItgb5) for 48 h, and then subjected to 18 h of LPS (1μg/mL) treatment. Numbers 1, 2, and 3 refer to three independent experimental analyses of log2[(LPS+siCon)/(LPS+siItgb3/5)]. (C and D) MMP-9 gene expressions were measured in PMVECs transfected with siItgb3/5 for 48 h prior to 18 h of LPS (1μg/mL) treatment. (E and F) Western blot analysis of MMP-9 protein levels from PMVECs transfected with control siRNA (siCon) or siItgb3/5 for 48 h prior to 18 h of PBS or LPS (1μg/mL) treatment. (G and H) Western blot analysis of MMP-9 protein levels from PMVECs transfected with Itgb3/5 plasmid in a dose course and then exposed to LPS (1μg/mL). ELISA analysis of MMP-9 secretion from PMVECs transfected with Itgb3/5 plasmid (I) or siItgb3/5 (J) and then exposed to PBS or LPS (1μg/mL). *P<0.05, **P<0.01. All the results are from at least three independent experiments; Data represent means ±SEM.](/cms/asset/12d50c4f-f3b5-43bc-b316-0436dbba8781/djir_a_12190481_f0003_c.jpg)
Figure 4 Integrin β3 regulates inflammatory response and permeability in vitro. PMVECs were transfected with empty or Itgb3 plasmid for 48 h, and then cells were exposed to rMMP-9 (10 ng/mL) for 1h, followed by treatment with LPS (1μg/mL) at indicated times. (A) NF-κB signaling proteins (p-IKK, IKKβ, p-P65, P65, IκBα, and p-IκBα) were measured by Western blot. Supernatant IL-6 (C) and CXCL-1 (E) secretions were measured by ELISA. (G) The permeability of treated PMVEC monolayers grown on 0.4 mm filters was determined by the appearance of rhodamine-dextran. PMVECs were transfected with control siRNA, or Itgb3 siRNA for 48 h, and then cells were exposed to rMMP-9 for 1h, following by treatment with LPS at indicated times. (B) NF-κB signaling proteins were measured by Western blot. Supernatant IL-6 (D) and CXCL-1 (F) secretions were measured by ELISA. (H) The permeability of treated PMVECs was determined by the appearance of rhodamine-dextran. *P<0.05, **P<0.01. All the results are from at least three independent experiments; Data represent means ±SEM.
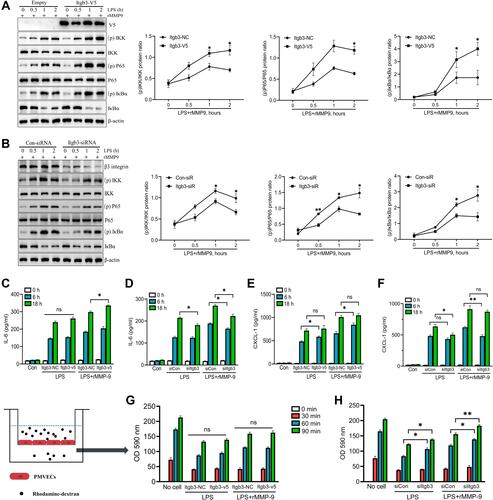
Figure 5 β5 Integrin/MMP-9 axis modulates inflammatory response and permeability in vitro. PMVECs were transfected with empty or Itgb5 plasmid, or control siRNA or Itgb5 siRNA for 48 h, and then cells were exposed to rMMP-9 (10 ng/mL) for 1h, followed by treatment with LPS (1 μg/mL) in a time course. (A and B) Immunoblot analysis of NF-κB signaling protein abundances (p-IKK, IKKβ, p-P65, P65, IκBα, and p-IκBα) was measured. (D and F) Supernatant IL-6 secretion was measured by ELISA. (I and J) The permeability of treated PMVECs was determined by the appearance of rhodamine-dextran. (C and E) 293T cells were co-transfected with NF-kB dual luciferase reporter plasmids along with empty or Itgb5 plasmid, or control siRNA or Itgb5 siRNA for 48 h, and then cells were treated with LPS (1 μg/mL) for an additional 6 h or 18 h. Cells were then collected and assayed for luciferase activity to evaluate NF-kB promoter activity. (G) PMVECs were transfected with control siRNA or Itgb5 siRNA for 48 h, and then cells were exposed to LPS for 18 h. The intercellular ROS levels were detected by flow cytometry. (H) PMVECs were treated with or without ROS scavenger, Nac (10 mM) for 1 h, prior to LPS (1 μg/mL) administration for 18 h, and immunoblot analysis of PMVECs and immunoprecipitation (IP) of Integrin β5. *P<0.05, **P<0.01. All the results are from at least three independent experiments; Data represent means ±SEM.
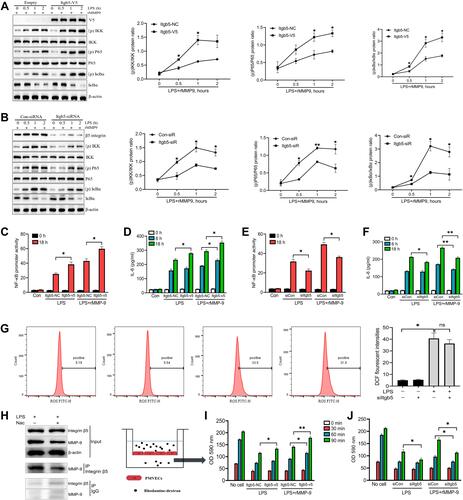
Figure 6 β5 Integrin/MMP-9 axis regulates acute lung injury in vivo. (A) Immunoblot analysis of β5 Integrin and MMP-9 from mice intratracheally treated with control or LPS for 18 h. Data and means ± SEM of 4 mice per group. (B) Linear regression of Itgb5 gene expression normalized to control mice vs BALF MMP-9 in ALI subjects (n=12). (C) EBA uptake, (D) protein concentrations, (E) total cell counts, and (F) neutrophils from BAL fluid of mice intratracheally treated with Lenti-Empty or Lenti-Itgb5 and then treated with LPS and PBS or recombinant MMP-9, as indicated. Data and means ± SEM pooled of 3 mice per group are from 2 independent experiments. (G) EBA uptake, (H) protein concentrations, (I) total cell counts, and (J) neutrophils from BAL fluid of mice intratracheally treated with Lenti-control shRNA or Lenti-Itgb5 shRNA and then treated with LPS and PBS or recombinant MMP-9, as indicated. Data and means ± SEM pooled of 3 mice per group are from 2 independent experiments. (K) Histological analysis of lung samples from mice treated as indicated. Images are representative of all independent experiments. (L) Survival rates of mice treated as indicated. *P<0.05, **P<0.01, ***P<0.001, ****P<0.0001.
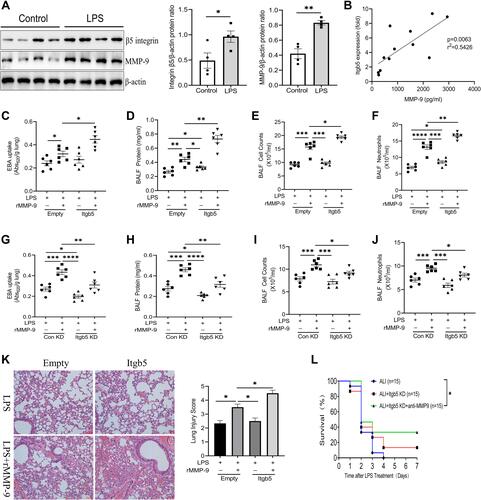
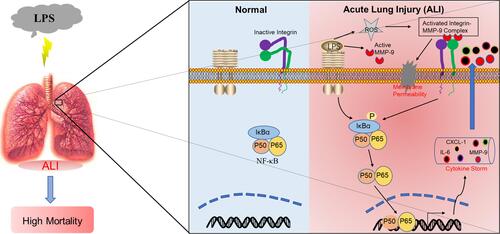
Figure 7 Scheme showing that β5 integrin/MMP-9 axis-mediated acute lung injury by promoting pulmonary inflammatory disorders and endothelial permeability.