Figures & data
Figure 1 Morphometric analysis of diabetes-induced osteoporosis measured by μCT. (A). The total volume of interest (VOI) area indicated in the white box. And the bone volume of interest area indicated in the red box. (B). Morphometric imaging shows the porosity of maxillary bone surface was obviously increased in diabetic rats in comparison with normal control and D+CMC2.24 treated rats. (C). The analysis of bone volume fraction (BV/TV) by μCT. VOX: based on counting voxels; TV: total volume (mm3); BV: bone volume (mm3). (D). The analysis of bone mineral density (BMD) by μCT based on calculating the units of hydroxyapatite density (mg HA/cm3). White bar: N, normal group; Black bar: D, diabetic group; Gray bar: D+CMC2.24, diabetes+CMC2.24 treatment group. Each value represents Mean (n=6/group) ± Standard Error (S.E.M.) *Indicates p<0.05 values compared between groups at the same time period.
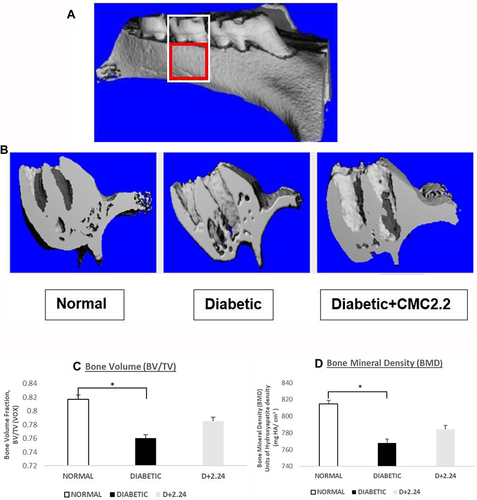
Figure 2 Effect of CMC 2.24 treatment on levels of pro-, activated-and total MMP-9 in blood plasma. STZ-diabetic rats in treatment group were administered daily by oral gavage CMC2.24 (30mg/kg) for 4-months. Blood plasma was collected at 2-months and 4-months. Gelatinase activities were analyzed by gelatin zymography and scanned by densitometer. Black bar: pro-MMP-9 activity; White bar: activated-MMP-9 activity; Gray bar: total-MMP-9 activity. Control (2 Mo): normal group at 2-months; Control (4 Mo): normal group at 4-months; Diabetic (2 Mo): diabetic group at 2-months; Diabetic (4 Mo): diabetic group at 4-months; D+2.24 (2 Mo): diabetes+CMC2.24 group at 2-months; D+2.24 (4 Mo): diabetes+CMC2.24 group at 4-months. Each value represents Mean (n=6-8 rats/group) ± Standard Error (S.E.M.) *Indicates p<0.05; **Indicates p<0.01, #Indicates p<0.0005 values compared between groups at the same time period.
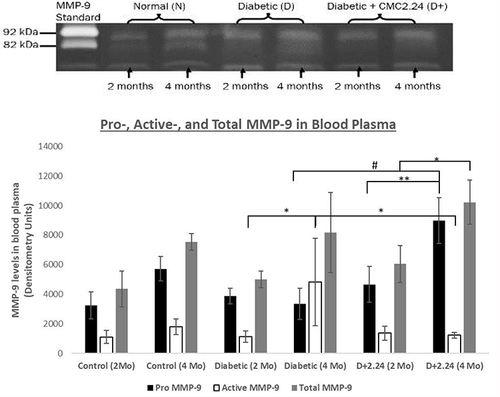
Figure 3 Effect of in vivo CMC 2.24 treatment on levels of pro-, activated-and total MMP-9 and Total-MMP-2 in rat non-elicited CFPF. STZ-diabetic rats in treatment group were administered daily by oral gavage CMC2.24 (30mg/kg) for 4 months. Resident CFPFs were collected on the day of sacrifice. Gelatinase activities were analyzed by gelatin zymography and scanned by densitometer. (A). MMP-9 in CFPFs. White bar: pro-MMP-9 activity; Black bar: activated-MMP-9 activity; Gray bar: total-MMP-9 activity. N, normal group; D, diabetic group; D+CMC2.24, diabetes+CMC2.24 treatment group. (B). MMP-2 in CFPFs. White bar: MMP-2 activity in Normal group; Black bar: MMP-2 activity in Diabetic group; Gray bar: MMP-2 activity in Diabetes+CMC2.24 treatment group. N: normal group; D: diabetic group; D+CMC2.24: diabetes+CMC2.24 treatment group. Each value represents Mean (n=6-8 rats/group) ± Standard Error (S.E.M.) *Indicates p<0.05, **Indicates p<0.01, ***Indicates p<0.005, #Indicates p<0.0005 values compared between groups at the same time period.
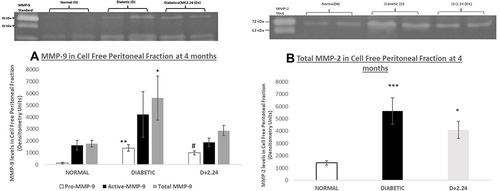
Figure 4 Effect of in vivo CMC 2.24 treatment on resolvin-enhancing activity in rat CFPE. CFPF were then analyzed for resolvin-enhancing activity by ELISA. RvD1 levels (ng/mL) in Cell Free Peritoneal Exudate. White bar: RvD1 levels in Normal group; Black bar: RvD1 levels in Diabetic group; Gray bar: RvD1 levels in Diabetes+CMC2.24 treatment group. N, normal group; D, diabetic group; D+CMC2.24, diabetes+CMC2.24 treatment group. Each value represents Mean (n=6-8/group) ± Standard Error (S.E.M.) *Indicates p<0.05; **Indicates p<0.01 values compared between groups at the same time period.
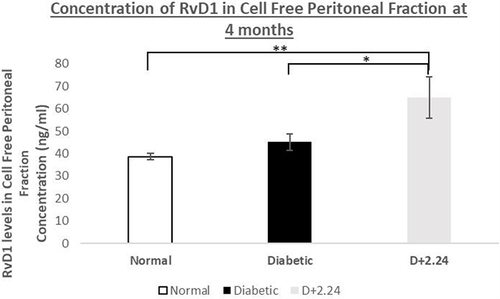
Figure 5 Comparison of blood glucose and glycated hemoglobin (HbA1c) levels between the 3 groups of rats. (A). It shows the levels of blood glucose (mg/dL) in normal/control (non-diabetic), untreated diabetic and the CMC2.24-treated diabetic rats, respectively. Black bar: 2 months; White bar: 4 months. And (B). It shows the levels of HbA1c (%) in normal/control (non-diabetic), untreated diabetic and the CMC2.24-treated diabetic rats, respectively. Black bar: 2 months; White bar: 4 months. N, control (non-diabetic) group; D, diabetic group; D+CMC2.24, diabetes+CMC2.24 treatment group. Each value represents Mean (n=6/group) ± Standard Error (S.E.M.) ##Indicates p value < 5×10⁻⁵ values compared between groups at the same time period.
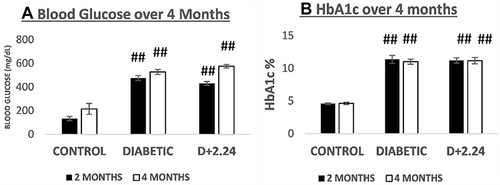
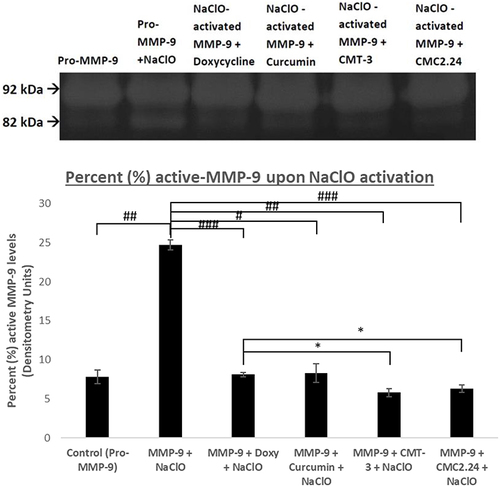
Figure 6 Effect of in vitro CMC 2.24, Doxycycline, Curcumin, and CMT-3 treatment on human recombinant MMP-9 activity. Human recombinant MMP-9 was activated with sodium hypochlorite (NaClO) and treated with CMC 2.24, Doxycycline, Curcumin, and CMT-3 incubated at 37°C. Active MMP-9 activities were analyzed by gelatin zymography and scanned by densitometer. Black bar: active MMP-9. Each value represents Mean (n=2-4/group) ± Standard Error (S.E.M.). *Indicates p<0.05 #Indicated p<0.0005, ##Indicated p<5 x 10⁻⁵, ###Indicates p< 1×10⁻⁶ values compared between groups at the same time period.