Figures & data
Figure 1 Immunofluorescence of BDNF in nasal ciliated epithelial cells. (A) Immunofluorescence co-staining of BDNF (green) and MUC5AC (red), β-Tubulin (red) in nasal epithelial cells. (×400 magnification scale bar = 20 μm). (B) BDNF-specific staining displayed different intensities and localization in the cytoplasm, which can be roughly divided into five types (type I-V). (×1000 magnification scale bar = 10μm). (C) The BDNF expression pattern model in ciliated cells. (D) BDNF proportion of each type in the AR and NC group, The bar graph showed the mean proportion of each type. (E) BDNF MFI in nasal ciliated epithelial cells in AR and NC groups, indicating the expression of BDNF in nasal ciliary cells of allergic rhinitis patients decreased significantly. The difference was analyzed by GraphPad 8, and statistical significance was detected by the Mann–Whitney test. ns means “no significant”, *Means p<0.05, **Means p<0.01, ***Means p<0.001, ****Means p< 0.001.
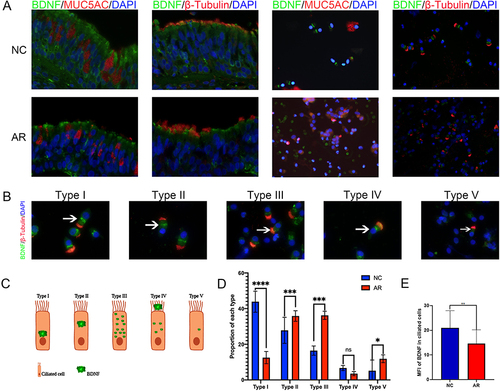
Figure 2 The NAL BDNF concentration was positively correlated with VAS scale but the MFI of BDNF was negatively correlated with VAS scale. (A) BDNF in nasal lavage in AR patients (n=12) and healthy control (n=12). (B) VAS of nasal and ocular symptoms (normal control n = 24, allergic rhinitis n = 45). (C) The correlation analysis of the NAL BDNF concentration and VAS scale. (D) The negative correlation of the MFI of BDNF and the nasal symptom score except for an itchy nose. The bar graph showed the average scale of every symptom and the Student’s t-test was performed to determine the statistical significance between the two groups. The correlation was analyzed with compute Pearson correlation coefficients. Data were presented as mean ± SD., *Means p<0.05, **Means p<0.01, ***Means p<0.001, ****Means p< 0.001.
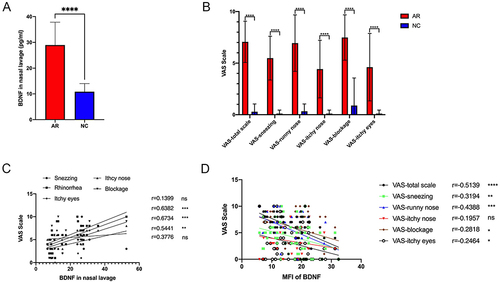
Figure 3 mRNA expression levels of BDNF and associated factors in AR and NC tissue. (A–D) mRNA levels of IL-4, IL-5, IL-13 and BDNF were detected by qRT-PCR. (E) The correlation with type II inflammation cytokines and BDNF. All data were analyzed by GraphPad 8, and statistical significance was detected by the Student’s t-test, correlations were analyzed by compute Pearson correlation coefficients. ns Means “no significant”, **Means p<0.01.
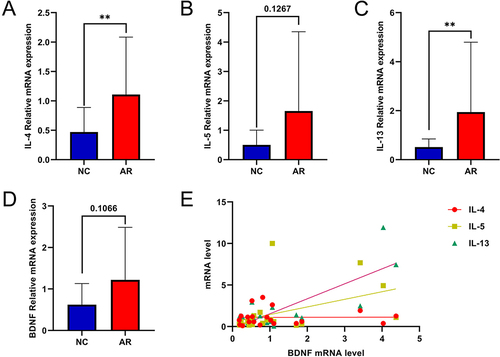
Figure 4 Experimental protocols for inducing AR in mice and expression of BDNF in mice. (A) The establishment and treatment process of AR mouse model and healthy control (more details could see in methods). (B and C) Serum total IgE and Ovalbumin special immunoglobulin E (s-IgE) were significantly increased in the allergic group by ELISA. (D and E) BDNF in serum and NAL fluid of mice in the allergic group were significantly increased with time correlation. Serum BDNF reached the peak at 3 h after the allergen challenge and then decreased gradually. BDNF in NAL fluid increased gradually after the allergen challenge, reached the maximum value at 6h, and then gradually decreased to the level of the NC group at 24h. (F) Immunofluorescence staining of nasal ciliated epithelial cells in 400× magnifications. (×400 magnification scale bar = 20 μm). (G) The MFI of BDNF of nasal ciliated epithelial cells in AR and NC groups, indicating the expression of BDNF in nasal ciliary cells of allergic rhinitis mouse was significantly increased at 3 h, 6 h, and 12 h after allergen challenge, but decreased at 24 h, showing no significant difference from the normal control group. All data were analyzed by GraphPad 8. Statistical significance was detected by the paired Student’s t-test method. ANOVA was performed for comparison among more than two groups. ns Means “no significant”, *Means p<0.05, **Means p<0.01, ***Means p<0.001,****p< 0.001.
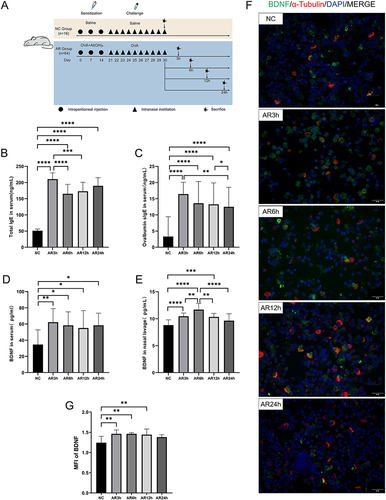
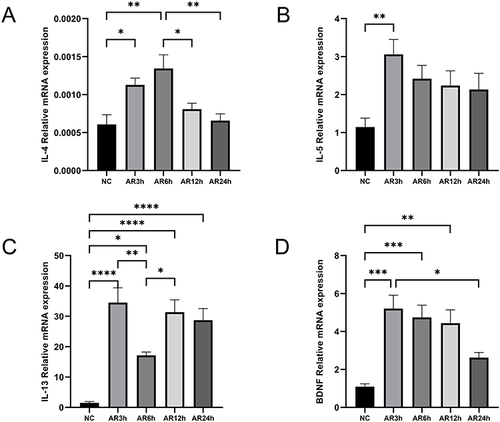
Figure 5 mRNA expression levels of BDNF and associated factors in AR and NC tissue. (A–D) mRNA levels of IL-4, IL-5, IL-13 and BDNF were detected by qRT-PCR and analyzed with GraphPad 8. Statistical significance was detected by the paired Student’s t-test method. ANOVA was performed for comparison among more than two groups. ns Means “no significant”, *Means p<0.05, **Means p<0.01, ***Means p<0.001,****p< 0.001.