
Figures & data
Figure 1 Number of publications and citations. (A) The number of annual publications on cancer and pain research from 2010–2019; (B) the number of annual citations on cancer and pain research from 2010–2019.
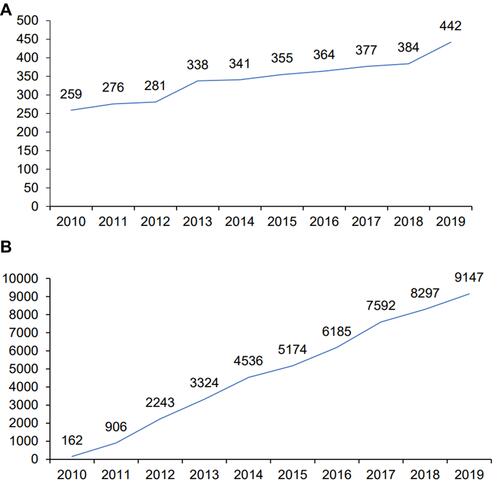
Figure 2 Number of papers, citations, citations per paper, open access paper, H-index, and citations in 2019 for each year time period.
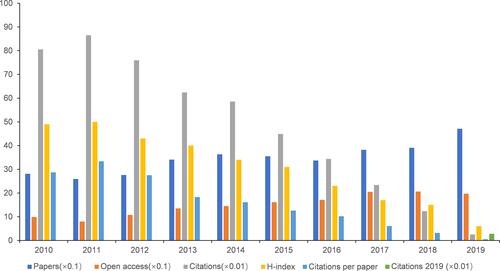
Table 1 The Top 20 Journals of Origin of Papers in the Cancer and Pain Research
Figure 3 The dual-map overlay of journals related to cancer and pain research.
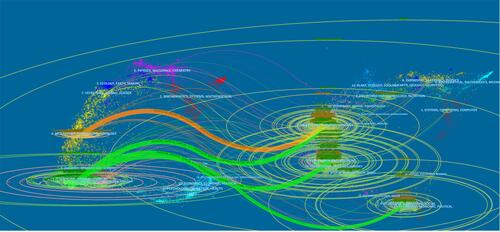
Figure 4 The number of papers, citations, citations per paper, open access papers, and H-index of the top 20 subject categories of Web of Science.
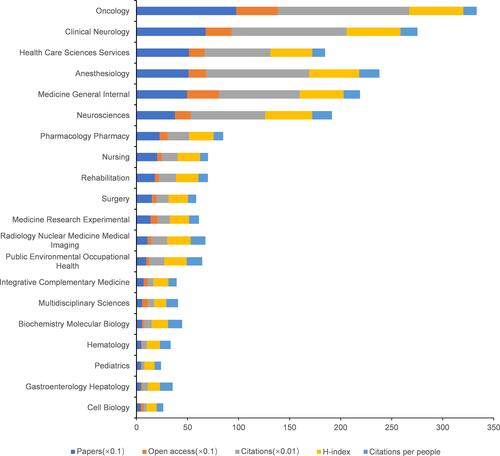
Figure 5 The number of papers, citations, citations per paper, open access papers, and value of H-index of the top 10 types of cancer.
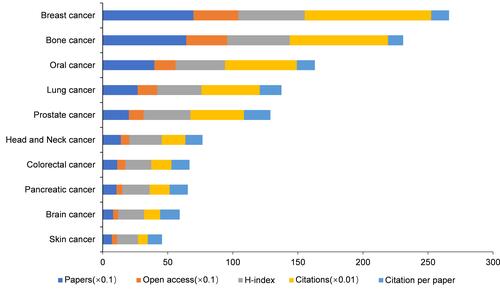
Figure 6 The number of papers, citations, citations per paper, open access papers and H-index of the top 10 countries.
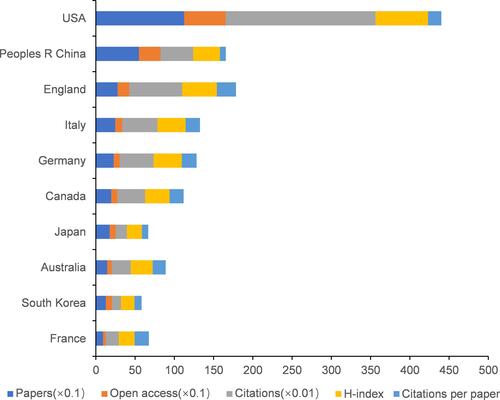
Figure 7 The analysis of countries and institutions. (A) Network map of countries/territories engaged in cancer and pain research. (B) Network map of institutions engaged in cancer and pain research.
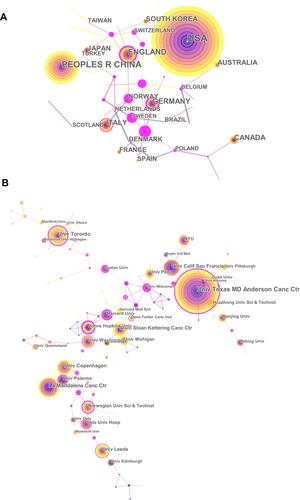
Figure 8 World map of total country output based on cancer and pain research.
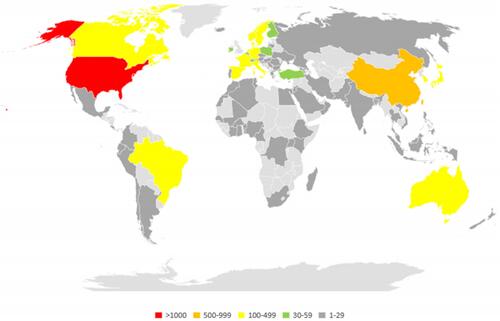
Table 2 The Top 10 Authors, Co-Cited Authors, and Co-Cited References in the Anxiety and Pain Research
Figure 9 The analysis of authors. Network map of active authors that contributed to cancer and pain research.
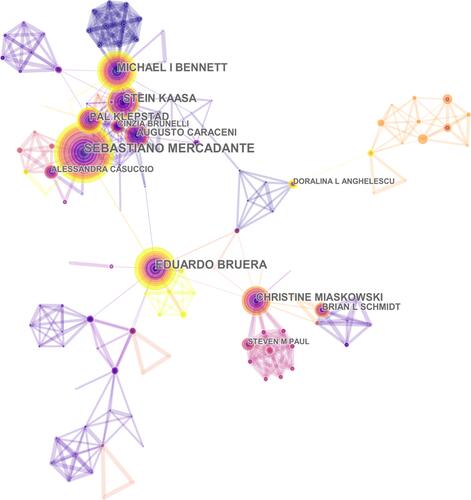
Figure 10 Trends in the percentage of single- vs multiple-authored articles per years.
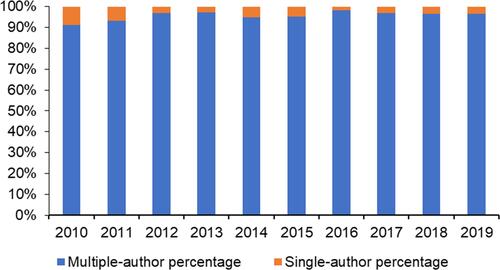
Figure 11 The analysis of references. Co-citation map (timeline view) of references from publications on to cancer and pain research.
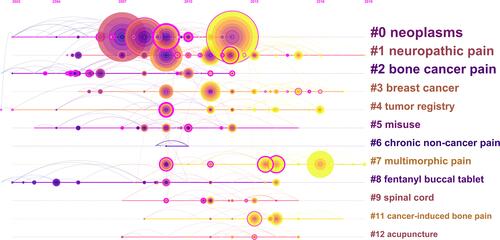
Figure 12 The keywords with the strongest citation bursts of publications on cancer and pain research.
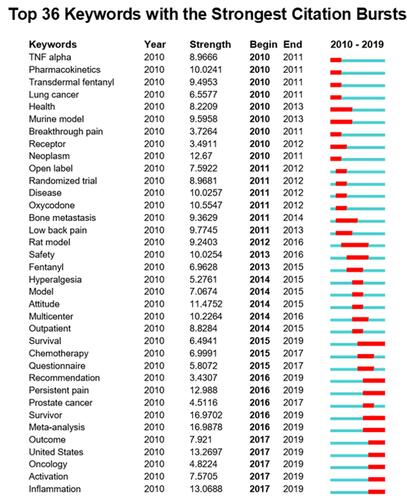
Table 3 The Top 10 Papers with the Largest Citation Frequency in the Cancer and Pain Research