
Figures & data
Table 1 Search Strategy Used to Identify Original Papers of IVD Biomechanics in the Web of Science Core Collection
Figure 1 Flowchart of literature selection in this study.
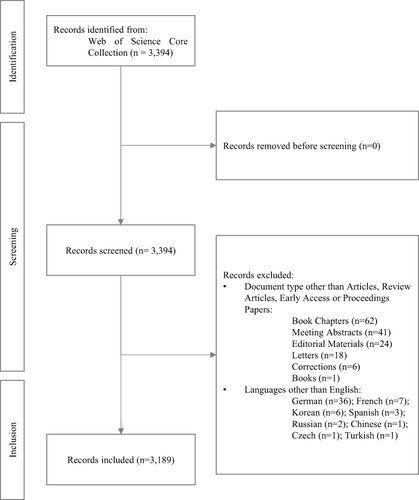
Figure 2 Trends of paper counts of IVD biomechanics. Each blue bar represents how many papers in IVD biomechanics were published each year. The trend of publications is represented by the red line, where the nodes were calculated by average count of two adjacent years.
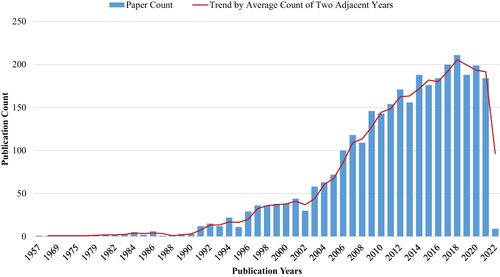
Table 2 Top 10 Original Papers in IVD Biomechanics with the Highest Annual Average Citation Counts
Table 3 Largest Clusters in the Co-Citation Network
Figure 3 Co-citation network of the references and its clustering. Nodes in the network represent references, and their size indicates citation counts contributed by IVD biomechanical studies. A node may have a number of rings with different colors, which means that they were cited in different time slices.Citation23 Connections represent co-citation relationships.
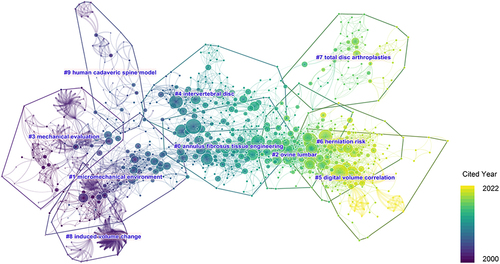
Table 4 References Most Highly Cited by Papers of IVD Biomechanics
Table 5 Top 10 References with the Strongest Citation Bursts
Figure 4 Citation bursts in the co-citation network. Red rings around the nodes represent the years when citation bursts can be found.
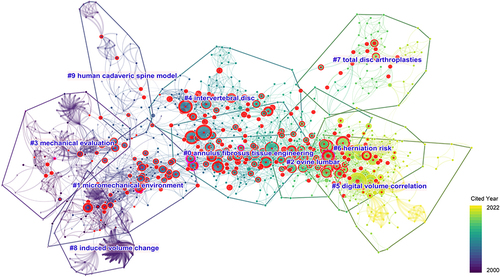
Table 6 References with the Highest Betweenness Centrality in the Co-Citation Network
Figure 5 Nodes positioned between clusters #0 and #1. There were five nodes with highest betweenness centrality highlighted by purple rings, where the thickness indicated the strength of betweenness centrality. Specifically, MacLean et al (2005)Citation32 and Holzapfel et al (2005)Citation33 were positioned between clusters #1 and 0, which are more likely to provide insights into topics evolution or emerging trends, while the other highlighted nodes were highly connected to other nodes within the same cluster, which may make them less important than the former. (A) Spotlight model of the co-citation network, which highlights nodes with high betweenness centrality. Close-ups of MacLean et al (2005)Citation32 (B) and Holzapfel et al (2005)Citation33 (C), which are positioned between clusters #0 and #1.
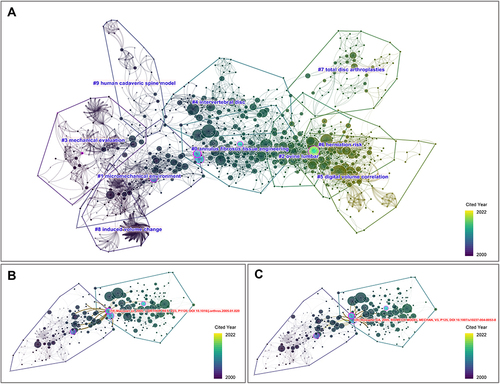
Table 7 Top 10 Authors with the Highest Citation Counts Contributed by Papers of IVD Biomechanics
Table 8 Top 10 Most Productive Journals in IVD Biomechanics
Figure 6 Top 20 journals with the most citations contributed by papers of IVD biomechanics in each 5-year slice. The fluctuation of top 10 journals with the most citations were presented. The gray straight line showed the ranking change of a certain journal in each 5-year slice. Spine, Eur Spine J, and J Biomech were the journals cited most by papers in IVD biomechanics in each time slice.
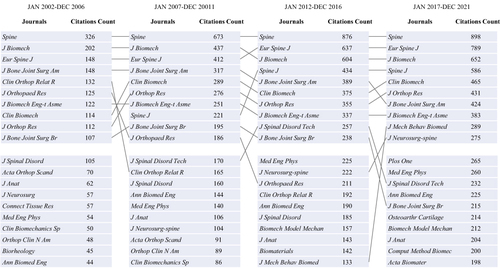
Table 9 Most Productive Countries/Regions in Two Recent 5-Year Time Slices