Figures & data
Figure 1 Participants completed four blocks of the continuous performance task with painful stimuli (CPTpain). Each block consisted of 120 stimuli, 36 of which were targets, (high intensity) stimuli distributed randomly within four sub-blocks. All stimuli were 20 ms laser pulses with a random interstimulus interval (ISI) between 4 and 9 s. The dotted line in the lower panel is the threshold temperature for pain, as established for participants individually.
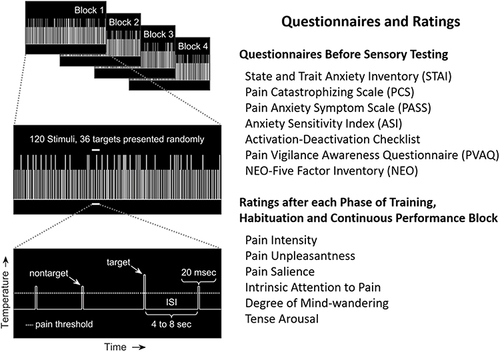
Figure 2 Vigilance metrics over the four blocks of continuous performance task (CPT) with a painful target. (A) Hits over time on task. (B) Hit reaction time over time on task. (C) False alarms over time on task. (D) False alarm reaction time over time on task. Bold error bars represent standard error of mean; boxes represent interquartile intervals. * = p < 0.05.
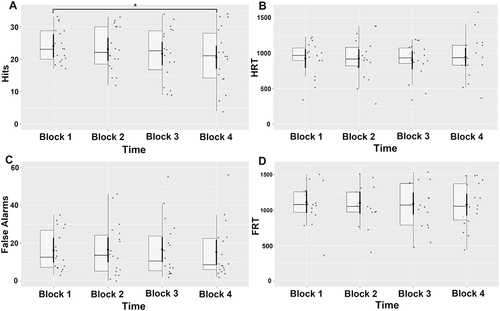
Figure 3 Pearson correlations between (A) salience and tense arousal during the continuous performance task with painful stimuli (CPTpain). Pearson correlations among (B) salience, pain intensity and pain unpleasantness and (C) change in salience, change in pain intensity, and change in pain unpleasantness during the continuous performance task with painful stimuli (CPTpain). Pearson correlations among (D) salience, pain intensity and pain unpleasantness and (E) change in salience, change in pain intensity, and change in pain unpleasantness during the habituation phase. In part A, the gray area indicates the 95% confidence interval.
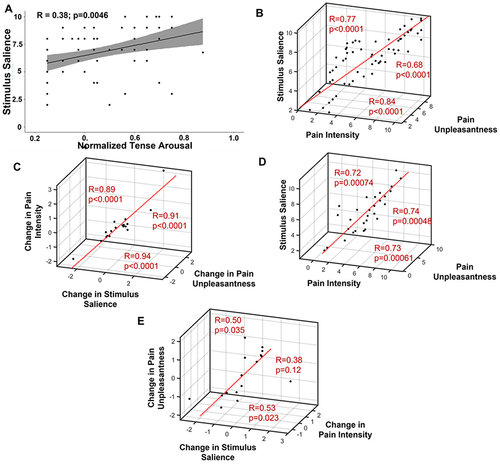
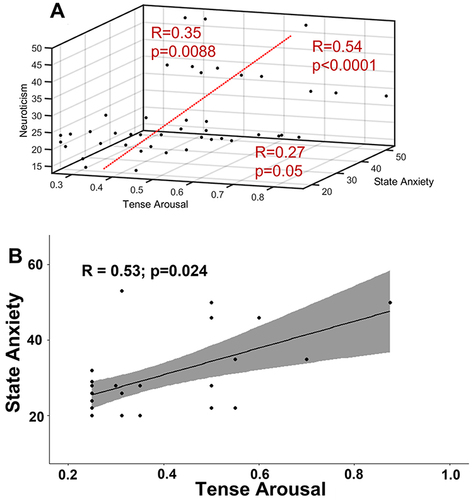
Figure 4 Pearson correlations among (A) neuroticism, state anxiety and tense arousal during the continuous performance task with painful stimuli (CPTpain). Pearson correlations between (B) tense arousal and state anxiety during the habituation phase. In part B, the gray area indicates the 95% confidence interval.