Figures & data
Figure 1 The Bone Conduction Implant System.
Notes: (A) An illustration of the principal design of an active transcutaneous bone conduction device (BCD) showing the audio processor (AP) components, the wireless induction link with retention magnets (N=north pole and S=south pole), and the transducer in the bone. The AP unit comprises microphones (Mic), a battery (Bat), a digital sound processor (DSP), a power amplifier (PA), and amplitude modulation (AM). (B) External view of the bone conduction implant (BCI).
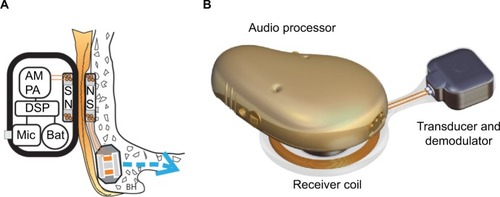
Figure 2 The Mechanical Tests.
Notes: (A) The striking directions used in the mechanical shock test and the pendulum test. (B) The setup for the random vibration test showing how to attach the transducer on a fixture in order to vibrate it in three orthogonal directions, showing the mounting of the transducer for vertical testing. (C) The setup for the mechanical shock test showing how the shock pulse A with an amplitude of 500 g and duration of 1 ms was applied to the implant. A compliant dampening material kept the implant in the device holder mechanically isolated from an aluminum rod being released from a height h into a wooden wall. (D) The setup for the pendulum or fall test showing how to strike the implant in order to simulate an accidental drop from height h. The implant rests on a flat surface and the aluminum rod is dropped from height h in a controlled motion giving a fixed collision velocity v. (E) The setup for the mechanical impact test showing how to apply the energy E of 2.5 J by dropping a spherical object of mass m from height h onto the implant as it rests on a solid and rigid surface, covered by a silicone sheet that represents the skin.
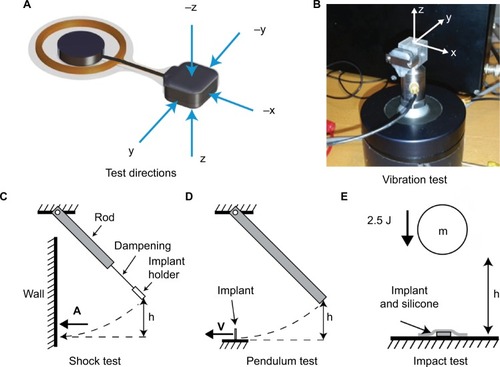
Figure 3 Mechanical exposure of the random vibration and the shock test.
Notes: (A) The time signal and (B) the acceleration spectral density of the same noise as applied in the random vibration test. (C) The average shape of the 500 g pulses over 1 ms that were applied to the five striking directions in the mechanical shock test.
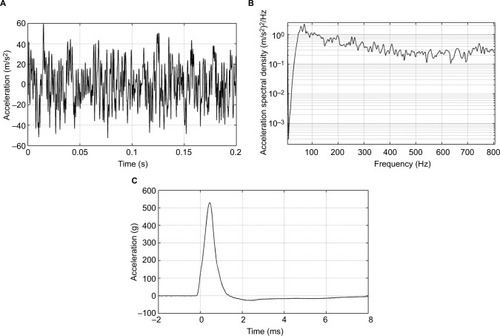
Figure 4 The external view of the age-acceleration sound chamber used in the long-term sound exposure test of the implant. The chamber includes the bone conduction implant attached to the skull simulator, a speaker playing the Swedish radio channel P1 at 79.8 dBA, a microphone, a heat source, and a temperature sensor.
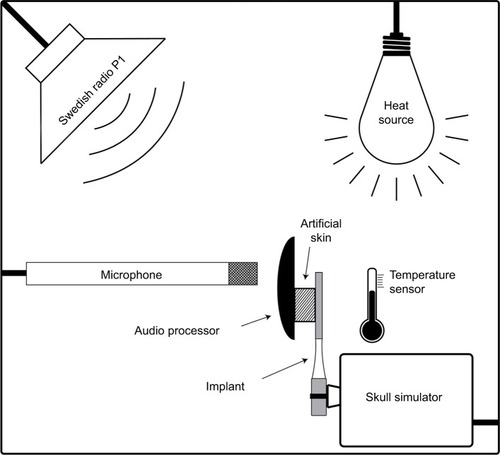
Figure 5 Setup for magnetically induced torque measurements.
Notes: (A) The mounting of the transducer inside the dipole electromagnet relative to the north and south poles where the magnetic field is uniform (1.5 T). (B) The transducer is fixed inside a cylindrical rod that can rotate with low friction, and a force gauge is connected to a disc on the rod to enable torque measurements. At one end an angle meter is positioned.
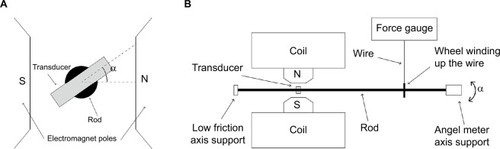
Figure 6 Setup for acoustic and electric measurements.
Notes: (A) Electro-acoustic measurement setup for output force level and total harmonic distortion (THD) of the full bone conduction implant (BCI) system. The implant and audio processor are attached to the skull simulator inside the anechoic test chamber B&K 4222, where a speaker generates a constant sound pressure level from 100 to 10,000 Hz. A microphone connected to a power supply (mic power supply) and high pass filter amplifier (HPF & 20 dB gain) verifies the sound pressure level, and a laptop reads the output signal from the skull simulator. The measurement is monitored and controlled using SoundCheck software (Varst Technology) through a soundcard interface. (B) Setup for the electric frequency response measurements of the implant, from 100 to 10,000 Hz, using a skull simulator, an Agilent 35670A FFT Dynamic Signal Analyzer, and an Agilent 33220A Function/Arbitrary Waveform Generator (Agilent Technologies). The measurement was recorded using LabVIEW software via a universal serial bus (USB) interface.
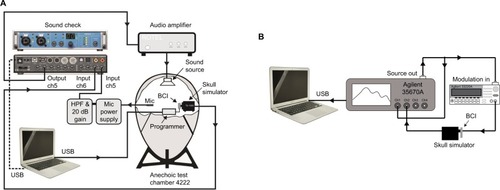
Figure 7 The frequency response with electric input of 1 Vpeak to the transducer before (solid line) and after (dashed line) (A) the random vibration test, (B) the mechanical shock test, (C) the pendulum test, and (D) the 2.5 J impact test.
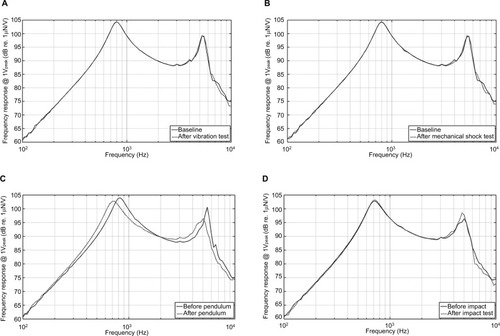
Figure 8 Performance after the age-accelerated test.
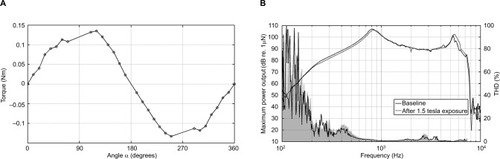
Notes: (A) Frequency response of the transducer at baseline (dashed line) and for 3 years (solid lines) in the age-accelerated test, and (B) maximum power output (MPO) at 90 dB sound pressure level (SPL) of the transducer at baseline (dashed line) after the age-accelerated test (solid line), and total harmonic distortion (THD) at 70 dB SPL (gray area) in comparison with baseline (solid line).
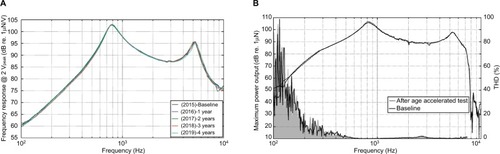
Figure 9 Results from the MRI testing.