
Figures & data
Table 1 HTR2C variants considered in the present case–control study in a Mexican population
Table 2 Sociodemographic features of controls and suicide attempters in a Mexican population
Table 3 Genotype and allele distributions of HTR2C variants in a Mexican population
Figure 1 LD in HTR2C markers (rs547536, rs2192372, rs4272555, rs6318, and rs2428707) in suicide attempters and controls in a Mexican population.
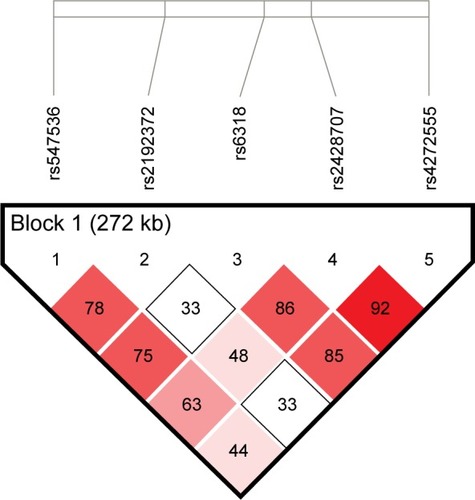
Table 4 Haplotypes for HTR2C markers rs547536 (A/G), rs2192372 (A/T), rs4272555 (C/T), rs6318 (C/G), and rs2428707 (A/G) in controls and suicide attempters
Figure S1 OR and forest plot for the meta-analysis of rs2428707.
Note: G allele vs A allele with heterogeneity.
Abbreviations: OR, odds ratio; CI, confidence interval.
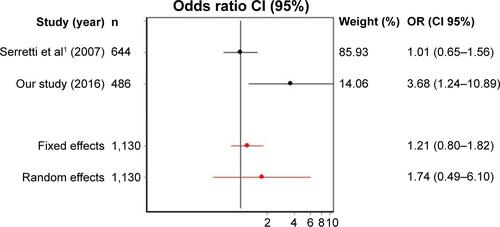
Figure S2 Egger’s funnel plot indicating publication bias for studies included in the meta-analyses.
Note: G allele vs A allele with heterogeneity.
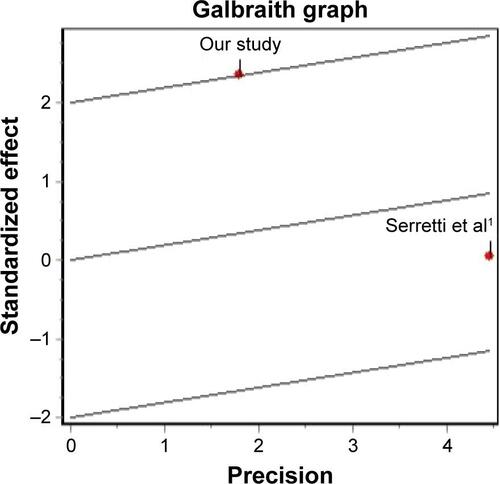
Figure S3 OR and forest plot for the meta-analysis of rs4272555.
Note: T allele vs C allele with heterogeneity.
Abbreviations: OR, odds ratio; CI, confidence interval.
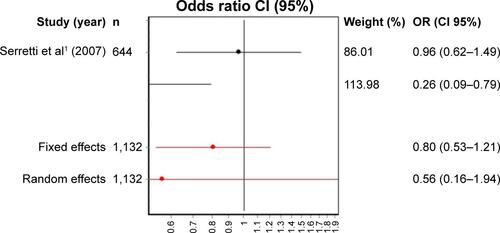
Figure S4 Egger’s funnel plot indicating publication bias for studies included in the meta-analysis of rs4272555.
Note: T allele vs C allele with heterogeneity.
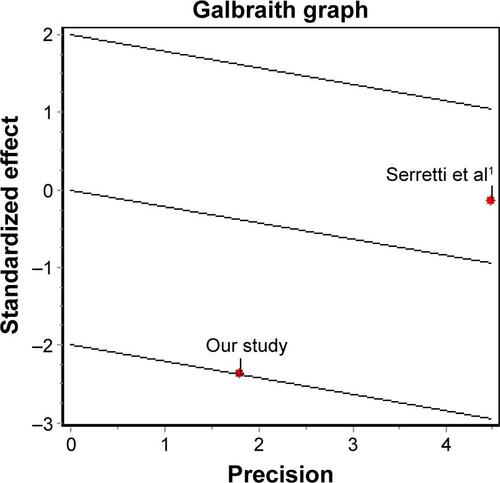
Table S1 Descriptive characteristics of two studies analyzing the role of the HTR2C gene variant rs2428707 in suicide attempt
Table S2 Descriptive characteristics of two studies in the meta-analysis of the HTR2C gene variant rs4272555 in suicide attempt