
Figures & data
Table 1 Baseline circadian markers of wrist activity in brief (RB) vs continued (RC) ketamine responder and nonresponder (NR) groups
Figure 1 Baseline and ketamine treatment 24-hour motor activity markers of rapid mood response.
Notes: Mean ± SEM estimated amplitude (left) and timing (phase; right) parameters for a 24-hour sinusoidal curve fit to wrist activity shown for three ketamine-treated patient cohorts: brief responders (RB), continued responders (RC), and nonresponders (NR). Parameter values shown for 3 days: baseline (BL), day 1 (D1) postketamine, and day 3 (D3) postketamine. Amplitude is expressed in mean activity counts/minute/hour, and timing is the clock time of estimated peak activity. Bonferroni-corrected α-criterion was set to P<0.0167. Letters above bars indicate the results comparing the amplitude and phase parameters of the NR cohort with the RC and RB cohorts. Numerals above bars indicate the results comparing the amplitude and timing parameters between the RC and RB cohorts. Group contrasts: a, b, P<0.05 (NS) and 0.005, respectively; 1, 2, P<0.05 (NS) and 0.005, respectively, vs RC.
Abbreviation: NS, not significant.
Abbreviation: NS, not significant.
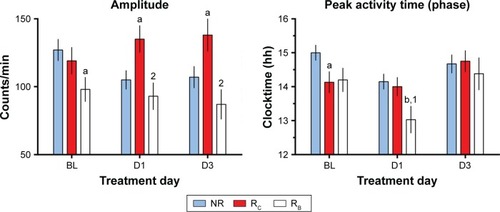
Figure 2 Baseline (BL), day 1 (D1), and day 3 (D3) Montgomery–Åsberg Depression Rating Scale (MADRS) score.
Notes: Baseline (BL), day 1 (D1), and day 3 (D3) Montgomery-Asberg Depression Rating Scale (MADRS) scores in three patient cohorts: brief responders (RB), continued responders (RC), and nonresponders (NR). No differences among group scores were observed at BL. On D1, scores for the NR cohort were higher than for both the RB and RC cohorts, which did not differ from each other. On D3, scores for the NR and RB cohorts were both higher than for the RC cohort.
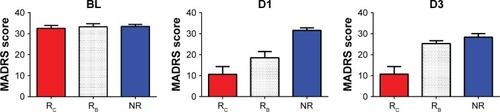
Table S1 Demographics of brief responder (RB) versus continued responder (RC) and nonresponder (NR) cohorts