
Figures & data
Table 1 Demographic and clinical characteristics of participants for loss of chromosome Y study
Table 2 Logistic regression analysis of LOY in peripheral blood samples from patients with schizophrenia and controls
Figure 1 Relationship between age and Y/X ratio in blood samples from patients with schizophrenia and controls. All P-values and r values were calculated using Spearman’s rho test.
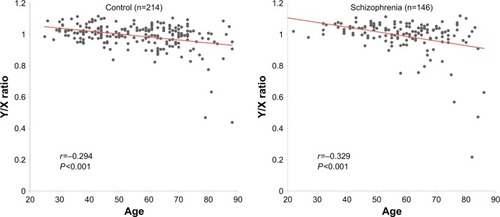
Table 3 Logistic regression analysis of LOY in peripheral blood samples of patients with schizophrenia
Figure 2 Dot plot of age for men with and without LOY in schizophrenia.
Abbreviations: LOY, loss of chromosome Y; SCZ, schizophrenia; IQR, inter-quartile range.
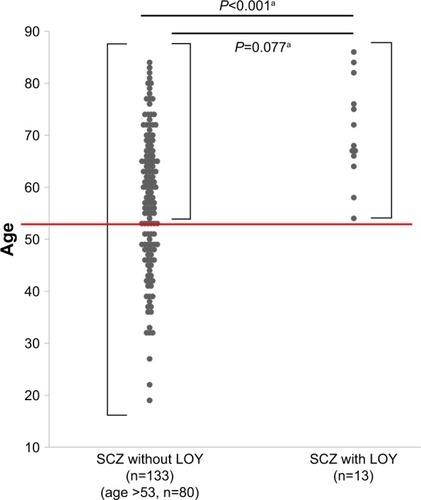
Figure S1 Correlation between duration of illness and age in patients with schizophrenia. P-value and r values were calculated using Spearman’s rho test.
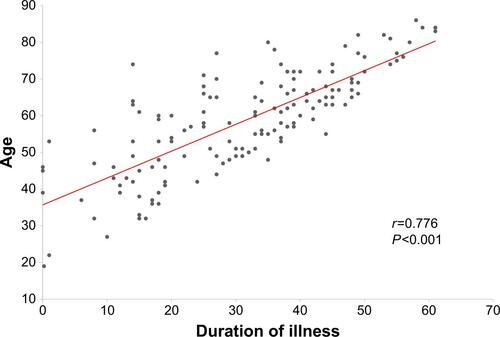
Table S1 Comparisons of demographic and clinical characteristics between participants with and without LOY in the schizophrenia group
Table S2 Logistic regression analysis of LOY in peripheral blood samples of patients with schizophrenia
Table S3 Smoking rates in Japanese men