Figures & data
Table 1 Demographic and Clinical Characteristics
Table 2 The SN Volume AIs Between ADHD and TD Groups
Table 3 The Cortical Thickness AIs Between the Two Subtypes in ADHD and TD Groups
Table 4 Pairwise Comparisons of the Cortical Thickness AIs Between the Two Subtypes in ADHD and TD Groups
Table 5 The Cortical Gray-Matter Volume and SN Volume AIs Between the Two Subtypes in ADHD and TD Groups
Table 6 Pairwise Comparisons of the Cortical Gray-Matter Volume AIs Between the Two Subtypes in ADHD and TD Groups
Figure 1 Correlation between the cortical thickness AI in the medial orbitofrontal and the severity of ADHD symptoms on the inattention subscale score.
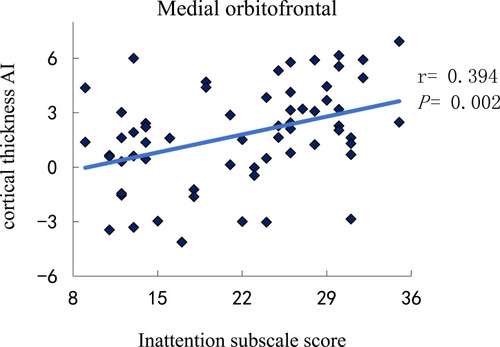
Figure 2 Correlation between the cortical thickness AI in the paracentral and the severity of ADHD symptoms on the inattention subscale score.
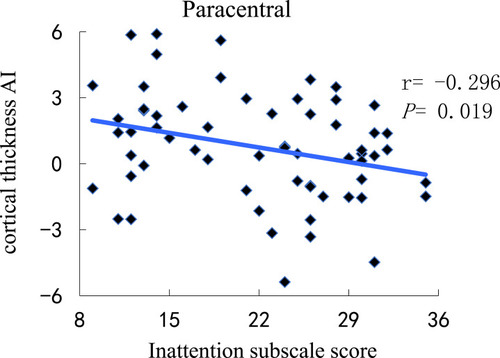
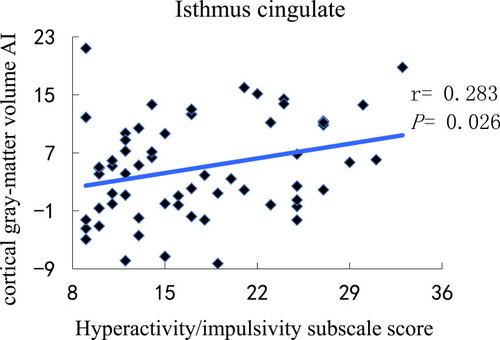
Figure 3 Correlation between the cortical gray-matter volume AI in the isthmus cingulate and the severity of ADHD symptoms on the hyperactivity/impulsivity subscale score.