Figures & data
Table 1 Main characteristics of the patients (n = 80)
Figure 1 In the upper panel (i) of each plot (A–C), the log2 test over reference ratio is plotted on the y-axis against the genomic Mb position from pter to qter on the respective chromosome represented by the idiogram on the x-axis in the lower part of each figure.
Notes: Each red dot represents the average value for a certain SNP probe. The normal ratio with value 0 is indicated by the solid, horizontal blue line. Values for normal ratios range between −0.38 and +0.3. Values outside this range are considered abnormal.Citation39 In panel (ii), the thick blue line represents the average of ten neighboring SNP probe values. In each figure, the aberrant chromosomal region is indicated by a rectangle that is enlarged in the lower left side of that figure. The gene content, 250 k SNP array probe coverage, structural variation and segmental duplications of the aberrant chromosomal region is shown in the lower right side of the figure (screen shot of the Human March 2006 (hg18) Assembly of the UCSC genome browser, http://genome.ucsc.edu/). In A, the interstitial 3.5 Mb loss in 1q21.1 of patient A is shown. In B, the interstitial gain in 1p13.3 (375 kb) detected in patient B is shown, and in C, the 1.1 Mb interstitial gain in 7q11.21q11.22 of patient C is shown.
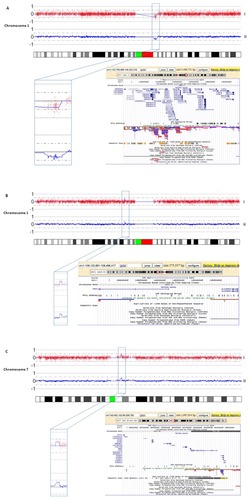
Table 2 Phenotype of the three patients with a potentially pathogenic CNV