Figures & data
Table 1 Baseline characteristics
Figure 1 Body weight change.
Notes: The values in the figure represent the LS means from the MMRM. The blue asterisks indicate the monthly comparison between the non-WCP and any WCP groups, and the green asterisks represent the monthly comparisons between the baseline WCP and post-baseline WCP groups; *P<0.05.
Abbreviations: LS, least squares; MMRM, mixed models for repeated measures; WCP, weight control program.
Abbreviations: LS, least squares; MMRM, mixed models for repeated measures; WCP, weight control program.
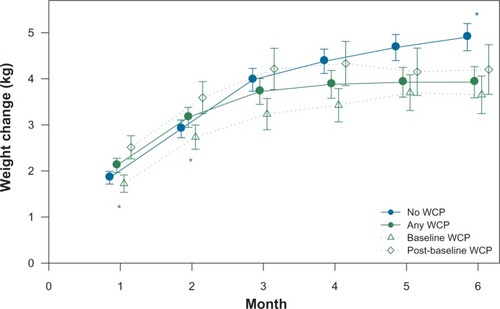
Figure 2 CGI-S change.
Notes: The values in the figure represent the LS means from the MMRM. The asterisks indicate statistical significance level (*P<0.05; ***P<0.001). The blue asterisks indicate the monthly comparison between the non-WCP and any WCP groups, and the green asterisks represent the monthly comparisons between to the baseline WCP and post-baseline WCP groups.
Abbreviations: CGI-S; Clinical Global Impression of Severity; LS, least squares; MMRM, mixed models for repeated measures; WCP, weight control program.
Abbreviations: CGI-S; Clinical Global Impression of Severity; LS, least squares; MMRM, mixed models for repeated measures; WCP, weight control program.
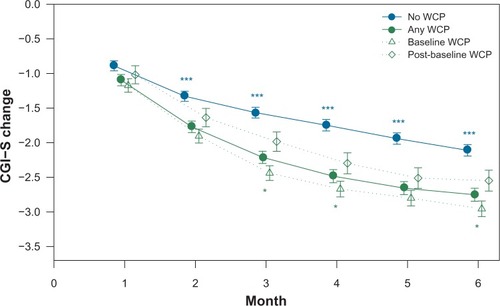
Figure 3 Time to first response during the study.
Notes: The log-rank tests showed that the patients who participated in any WCP had a significantly shorter time to symptomatic response than the non-WCP patients (P<0.001). There was no significant difference between baseline WCP and the post-baseline WCP patients (P=0.15).
Abbreviation: WCP, weight control program.
Abbreviation: WCP, weight control program.
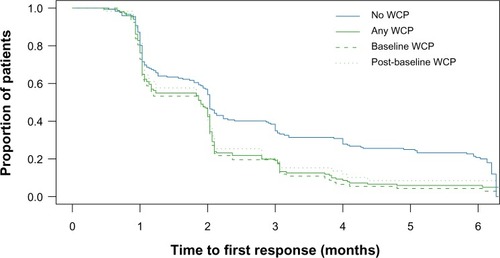
Figure 4 Change in work impairment.
Notes: The values in the figure represent the LS means from the MMRM. The blue asterisks indicate statistical significance level (*P<0.05) of the monthly comparison between the non-WCP and any WCP groups.
Abbreviations: LS, least squares; MMRM, mixed models for repeated measures; WCP, weight control program.
Abbreviations: LS, least squares; MMRM, mixed models for repeated measures; WCP, weight control program.
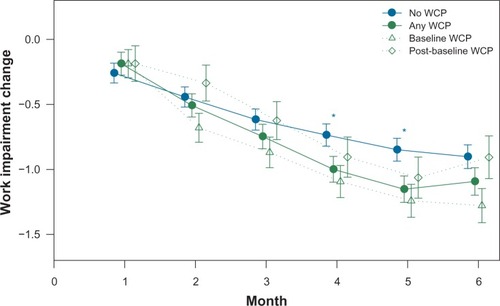
Figure 5 Change in patient insight.
Notes: The values in the figure represent the LS means from the MMRM. The blue asterisks indicate statistical significance level (*P<0.05; **P<0.01; ***P<0.001) of the monthly comparison between the non-WCP and any WCP groups, and the green asterisks represent the monthly comparisons between to baseline WCP and post-baseline WCP groups.
Abbreviations: LS, least squares; MMRM, mixed models for repeated measures; WCP, weight control program.
Abbreviations: LS, least squares; MMRM, mixed models for repeated measures; WCP, weight control program.
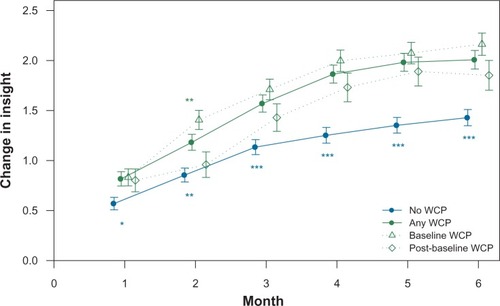
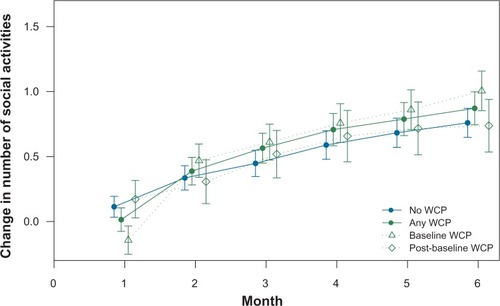
Figure 6 Change in social activities.
Note: The values in the figure represent the LS means from the MMRM.
Abbreviations: LS, least squares; MMRM, mixed models for repeated measures; WCP, weight control program.
Abbreviations: LS, least squares; MMRM, mixed models for repeated measures; WCP, weight control program.