
Figures & data
Figure 1 PRISMA flowchart of systematic review.
Abbreviations: PCOS, polycystic ovary syndrome; NIH, National Institutes of Health.
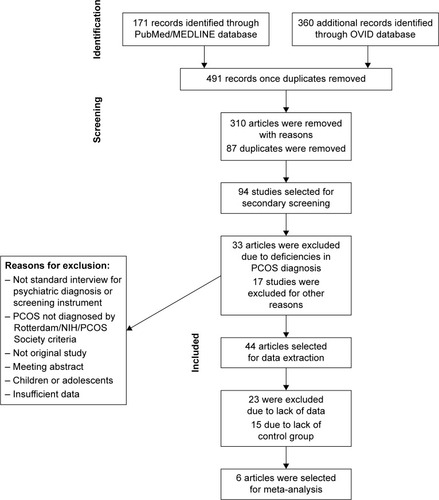
Table 1 Quality and characteristics of included studies
Figure 2 Forest plot of the studies assessing anxiety symptoms.
Abbreviation: RE model, random-effects model.
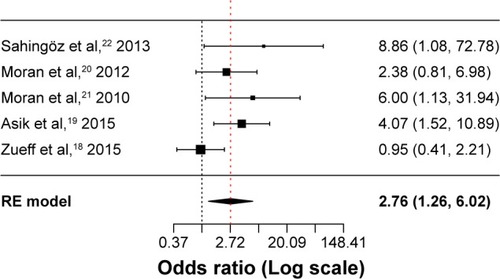
Figure 3 Funnel plot of the studies that assessed anxiety symptoms.
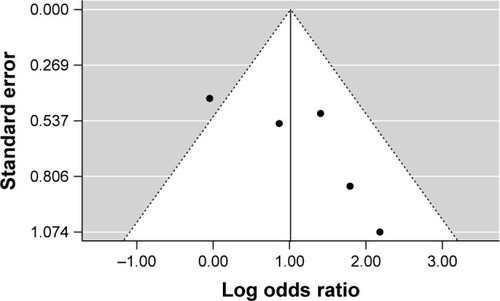
Table 2 Leave-one-out models for the meta-analysis of anxiety symptoms
Figure 4 Forest plot of the studies that assessed depressive symptoms.
Abbreviation: RE model, random-effects model.
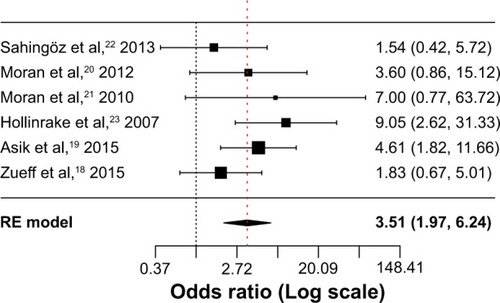
Figure 5 Funnel plot of the studies that assessed depressive symptoms.
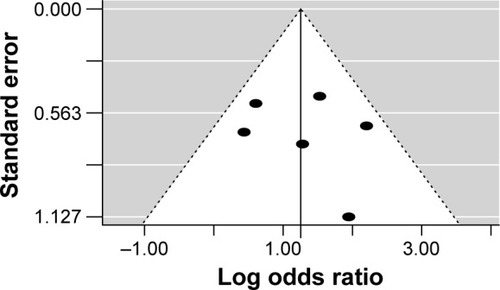
Table 3 Leave-one-out models for the meta-analysis of depressive symptoms