
Figures & data
Table 1 Demographic Characteristics of Patients with Obstructive Sleep Apnea and Control Participants
Table 2 Frequency of Comorbid Disease in OSA Patients and Controls
Table 3 Frequency of Prescription Medication in OSA Patients and Controls
Table 4 Psychomotor Test Performance of Patients with Obstructive Sleep Apnea and Control Participants
Table 5 Pearson Correlation Coefficients Between Psychomotor Tests Results and Severity of Apnea Expressed as AHI in Patients with Obstructive Sleep Apnea
Figure 1 Correlation between speed of perception to visual stimulus and AHI index of patients with OSA.
Notes: The scatter plot represents the association of a total test solving time needed to perform the perception to visual stimulus test and the severity of apnea expressed as AHI (r=0.256; P=0.011).
Abbreviations: CRD 311, test of speed of perception to visual stimulus; AHI, apnea hypopnea index; TTST, total test solving time.
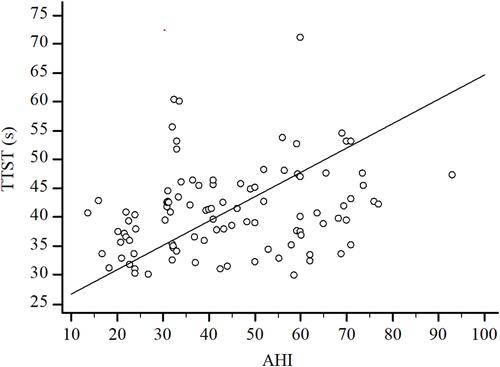
Table 6 Regression Analysis of Obesity, Age, Daytime Sleepiness and Severity of Apnea Indicators in the Prediction of Psychomotor Test Performance Among Patients with Obstructive Sleep Apnea
Figure 2 Total and minimal psychomotor reaction time of obstructive sleep apnea patients (n=103) and controls (n=103), divided at age groups.
Notes: Average minimum solving time of a single task and total test solving time for all three psychomotor tests (test of speed of perception to visual stimulus, test of speed of solving simple arithmetic operations, test of psychomotor limbs coordination) of patients with OSA (n=103) and control (n=103) subjects, divided at age groups. Solid lines are showing the reference range of test results in healthy subjects, dotted lines are showing the average test results for patients with OSA and dashed lines are showing the average test results for control subjects. Asterisk (*) indicates a significant difference with P<0.05 among OSA patients and controls of a single age group in a specific chronometric measure following t-test for independent samples.
Abbreviations: TTST, total test solving time; MinT, minimum solving time of a single task.
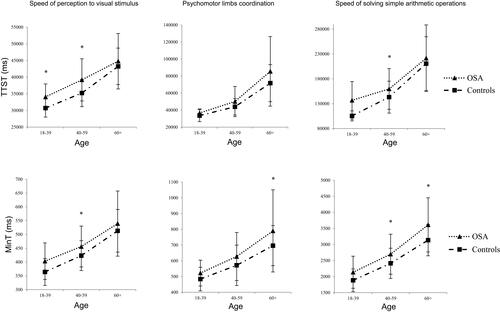
Table 7 Psychomotor Changes in Moderate and Severe OSA Patients Compared to Controls