Figures & data
Figure 1 Total sleep time (TST, (A)), dark period TST (B), and light period TST (C) expressed as a percentage, was assessed by EEG/EMG telemetry and Neuroscore sleep scoring (N = 5, white bar), or by corded EEG/EMG and human visual sleep scoring (N = 4, shaded bar), while simultaneously assessed and scored by PiezoSleep (N = 9, black bar). There was a statistical trend in the system main effect for TST ((A): F2,15 = 3.42, p = 0.06) and a significant difference in the light period TST ((B): F2,15 = 4.39, p = 0.03). Post hoc analysis revealed a statistical trend difference (p = 0.06) between the telemetry and PiezoSleep TST, and between DSI and telemetry/corded light period TST. Data were analyzed using a linear mixed model analysis with “system” (DSI vs Corded vs PiezoSleep) as a factor, followed by post hoc multiple comparison test with Sidak’s correction.
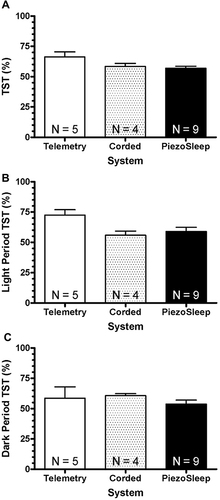
Table 1 Confusion Matrix for Wake/Sleep Scoring with EEG/EMG Telemetry (Scored with NeuroScore) and the PiezoSleep System (Scored with PiezoSleep/SleepStats)
Table 2 Confusion Matrix for Wake/Sleep Scoring with Corded EEG/EMG (Visually Scored by Human) and the PiezoSleep System (Scored with PiezoSleep/SleepStats)
Table 3 Agreements and Disagreements for Wake/REM/NREM and Wake/Sleep Scoring Between EEG/EMG Telemetry (Scored with NeuroScore) and the PiezoSleep System (Scored with PiezoSleep/SleepStats), Respectively
Table 4 Agreements and Disagreements for Wake/REM/NREM and Wake/Sleep Scoring Between EEG/EMG (Visually Scored by Human) and the PiezoSleep System (Scored with PiezoSleep/SleepStats), Respectively
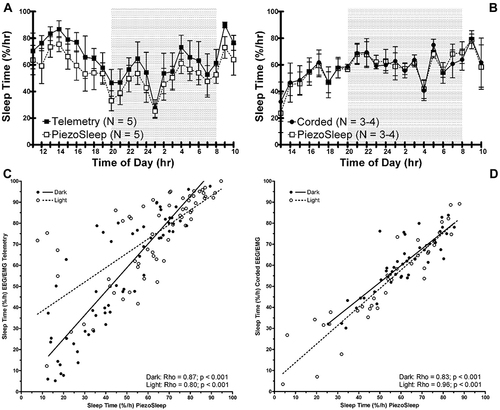
Figure 2 Representative hourly sleep percentages between the EEG/EMG telemetry (A) or corded EEG/EMG (B) and PiezoSleep systems, respectively, and Spearman correlation analysis between EEG/EMG telemetry and PiezoSleep (C) and corded EEG/EMG and PiezoSleep (D) systems. Shaded area represents the dark period. (A) There were significant main interactions (system factor: F1,45.69 = 6.72, p = 0.01; hour factor: F23,105.45 = 2.65, p < 0.001), but no significant interaction, observed between the EEG/EMG telemetry (N = 5, solid square/line) and PiezoSleep systems (N = 5, open square/dotted line). Post hoc analysis of system factor revealed that Neuroscore scored significantly more sleep compared to PiezoSleep. (B) In contrast, there were no significant system main or interaction effects, but only significant hour interaction (F21,69.60 = 3.39, p < 0.001), observed in the corded EEG/EMG (N = 3–4, solid square/line) and PiezoSleep systems (N = 3–4, open square/dotted line). (C and D) Spearman correlations were significant for both corded EEG/EMG and EEG/EMG telemetry when compared to PiezoSleep systems. The Spearman’s rho was the lowest for EEG/EMG telemetry/PiezoSleep during the light period. Data were analyzed using a linear mixed model analysis with “system” (DSI vs PiezoSleep or Corded vs PiezoSleep) and “hour” as factors, followed by post hoc multiple comparison test with Sidak’s correction. A Spearman correlation analysis was performed on the representative hourly sleep data recorded by the EEG/EMG telemetry and PiezoSleep systems or the corded EEG/EMG and PiezoSleep systems for the light and dark periods.