Figures & data
Figure 1 Model for eyelid transmittance proposed by Bierman et al. Figure adapted from Bierman A, Figueiro MG, Rea MS. Measuring and predicting eyelid spectral transmittance. J Biomed Optics. 2011;16(6):067011.Citation80 Copyright 2011 Society of Photo Optical Instrumentation Engineers. One print or electronic copy may be made for personal use only. Systematic electronic or print reproduction and distribution, duplication of any material in this paper for a fee or for commercial purposes, or modification of the content of the paper are prohibited. http://dx.doi.org/10.1117/1.3593151.
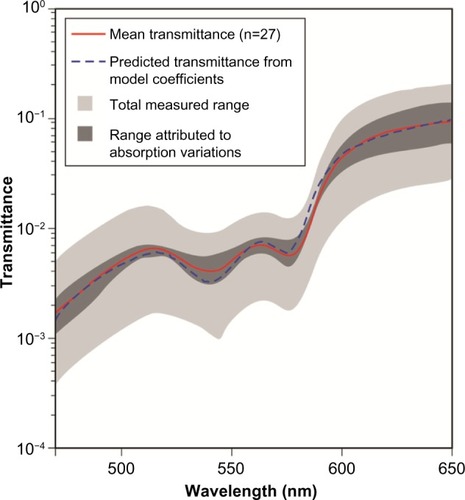
Figure 2 Flashing blue light mask used by older adults living at home.
Abbreviations: LED, light emitting diode; FWHM, full width at half maximum.
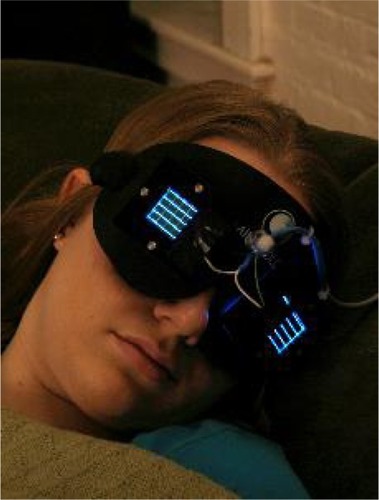
Table 1 Studies investigating how light can be used to treat DSPD symptoms in the lab and in the field
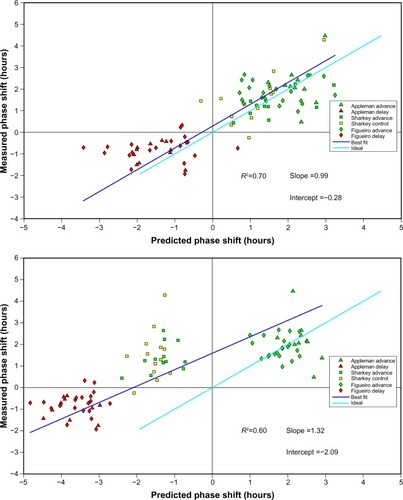
Figure 3 Correlation between DLMO and the predicted phase changes calculated from the Daysimeter data and the modified Kronauer model.