Figures & data
Figure 1 Flow diagram of included studies.
Abbreviations: WOS, Web of Science; TP, true positives; TN, true negatives; FP, false positives; FN, false negatives.
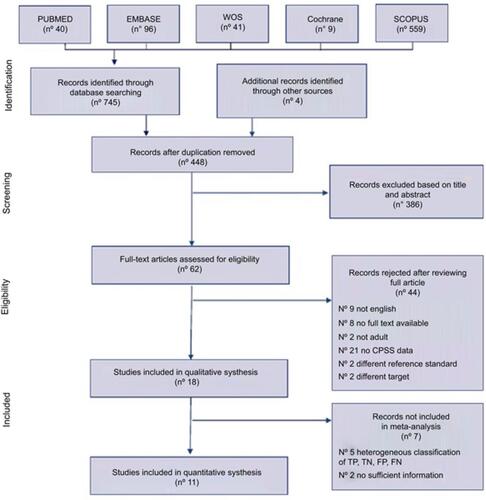
Table 1 Summary of study characteristics
Table 2 Results of the quality assessment according to the Revised Quality Assessment of Diagnostic Accuracy Studies -2 (QUADAS-2) tool
Figure 2 Stacked bar charts of Revised Quality Assessment of Diagnostic Accuracy Studies -2 (QUADAS-2) scores, presenting a quick overview of the methodological quality of the 18 included studies expressed as a percentage of studies that met each criterion.
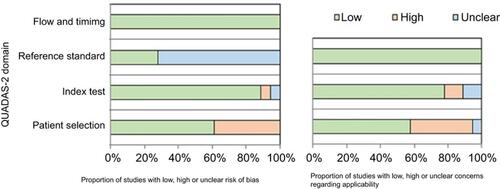
Figure 3 Data from meta-analyzed studies and forest plot for sensitivity and specificity of Cincinnati Prehospital Stroke Scale.
Abbreviations: TP, true positives; FP, false positives; FN, false negatives; TN, true negatives.
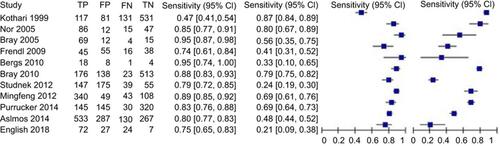
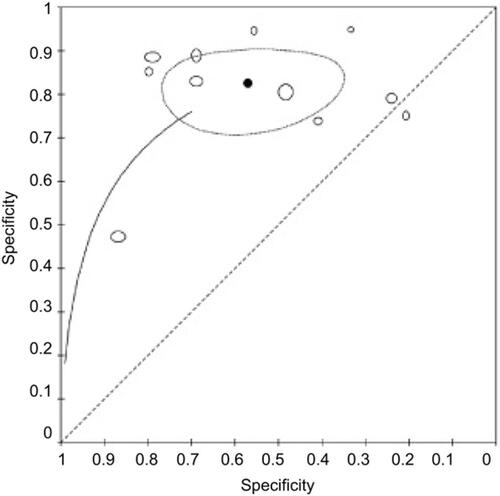
Figure 4 Summary receiving operating characteristic (sROC) curve.