Figures & data
Table 1 Demographic statistics of municipalities (N=1,742)
Table 2 Mortality rate and proportion of elderly in population by accessibility time
Figure 1 Correlation between accessibility time and mortality due to unintentional injuries in all municipalities.
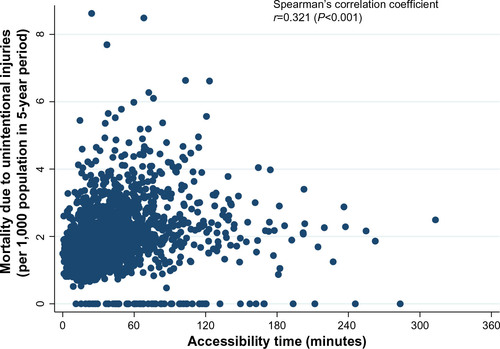
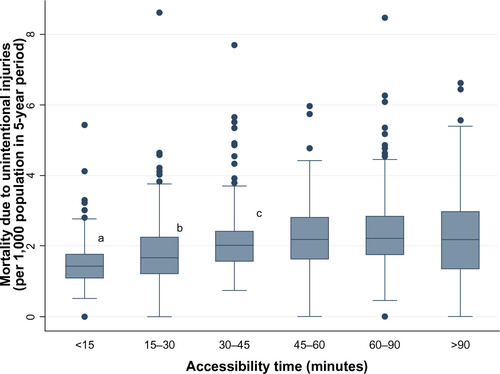
Figure 2 Age-adjusted mortality due to unintentional injuries in municipalities, categorized by accessibility time.
Notes: Box graph for each group: <15 minutes; 15–30 minutes; 30–45 minutes; 45–60 minutes; 60–90 minutes; >90 minutes. aMortality in group 1 was significantly lower than that in groups 2–6 (P<0.05, analysis of covariance adjusted for age); bmortality in group 2 was significantly lower than that in groups 3–6 (P<0.05, analysis of covariance adjusted for age); cmortality in group 3 was significantly lower than that in group 5 (P<0.05, analysis of covariance adjusted for age).