Figures & data
Figure 1 Corneal crystals. Slit- lamp biomicroscopy photo showing the crystalline deposits located at the limbus.
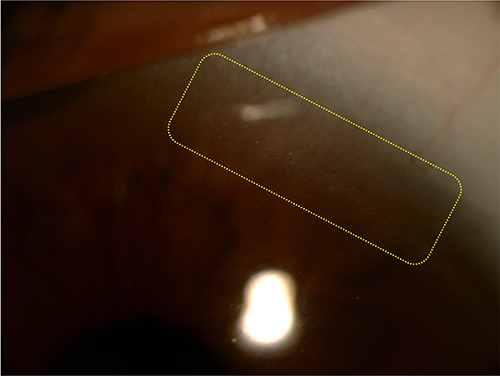
Figure 2 Features of advanced disease stage. Color fundus (A) and IR-R images. (B) of a left eye showing the marked diffuse chorioretinal atrophy and choroidal sclerosis with some pigment clumping areas. The horizontal SD-OCT section through the fovea (C) revealing the loss of EZ and RPE line with choroidal thinning.
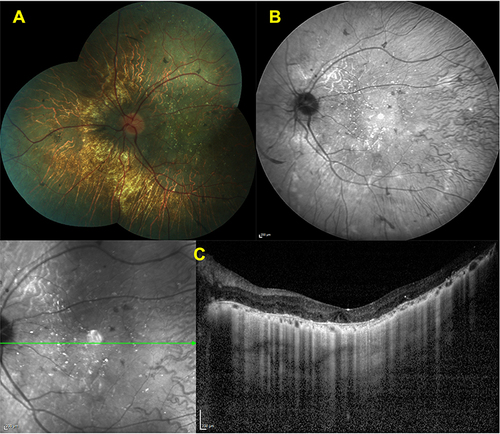
Figure 3 Features of early disease stage. Color fundus image of a left eye (A)showing scattered intraretinal crystals throughout the posterior pole. Infrared reflectance (IR-R) image (B) depicting the several bright reflective spots at posterior pole. Spectral domain-optical coherence tomography (SD-OCT) section (C) delineating the hyperreflective deposits at the retina pigment epithelium -Bruch’s membrane complex and ellipsoid zone (EZ) disruption in the left eye (C).
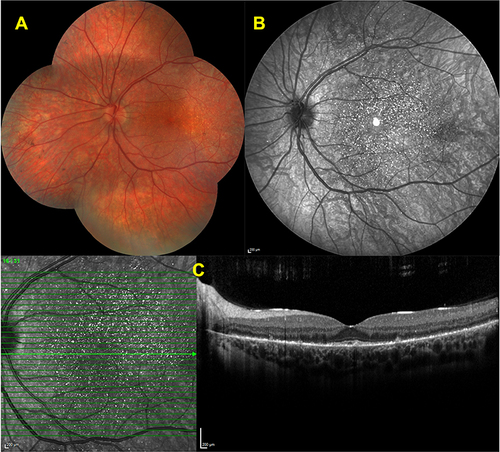
Figure 4 Features of intermediate disease stage. Color fundus image of a left eye (A) showing the chorioretinal atrophy extending from the posterior pole and glistening crystals at the macula. Fundus autofluorescence image (B) revealing the well-demarcated hypofluorescent patches corresponding to the atrophy. Spectral domain-optical coherence tomography (SD-OCT) section (C) demonstrating the hyperreflective deposits at the RPE – Bruch’s membrane complex, together with the disruption and loss of the EZ band.
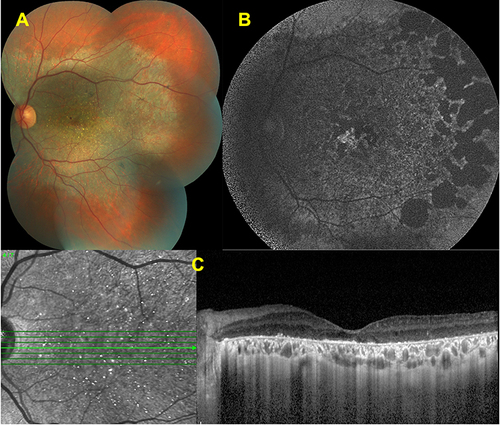
Figure 5 Associated macular neovascularization. Right eye, Color fundus image showing the hypopigmented looking well-demarcated lesion at the macula (A). The horizontal SD-OCT section demonstrating the macular neovascularization (B,C). Optical coherence tomography angiographic slabs demonstrating the presence of quiescent choroidal neovascularization (yellow arrows) (D–G).

Figure 6 Associated macular edema. Left eye, early venous (A) and late composite venous (B) fluorescein angiographic images revealing the increasing macular hyperfluorescence. SD-OCT section showing the cystoid macular changes corresponding to macular edema (C).
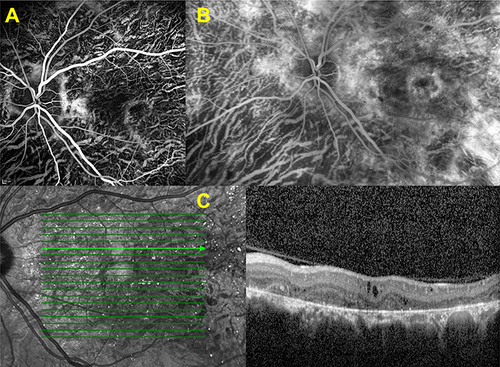
Figure 7 Associated macular hole. Left eye, color fundus image (A) delineating the extensive chorioretinal atrophy and choroidal sclerosis. FAF image (B) revealing the multiple hypofluorescent patches corresponding to the posterior pole. SD-OCT section showing the presence of full -thickness hole (yellow arrow) (C,D).
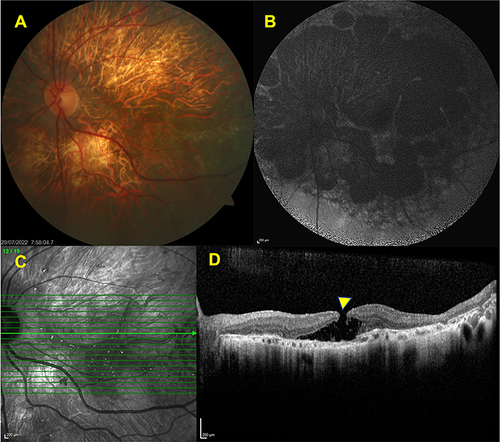
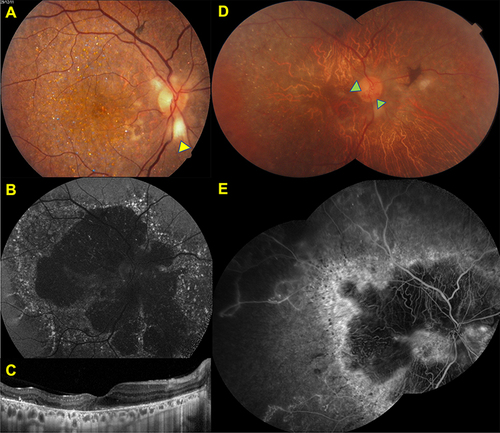
Figure 8 Incidental findings Right eye, Color fundus image (A) showing the scattered glistening crystals at the posterior pole and peripapillary myelinated nerve fiber (yellow arrow), FAF image (B) demonstrating the patchy hypofluorescent areas with ill-demarcated hyperfluorescent borders at the posterior pole in 2011. SD-OCT section (C) revealing the hyperreflective deposits at the RPE – Bruch’s membrane complex, disruption, and loss of the EZ band. Composite color fundus image (D) demonstrating the marked chorioretinal atrophy and attenuated retinal vessels with the optociliary shunt (green arrows) in 2021. Composite venous fluorescein angiographic image (E) revealing the nonperfused areas related to old central retinal vein occlusion detected in fluorescein angiography image shows extensive ischemic areas throughout posterior pole.