Figures & data
Table 1 Patient characteristics and their visual acuity before and after anti-VEGF treatment
Figure 1 Optical coherence tomographic (OCT) images illustrating retinal thickness of each individual patient (P1–P6) before and after injections (18 weeks in between images).
Notes: For each patient, the top row is before treatment and the bottom row is after treatment. White arrows point to the treated eye and defected sites in the retina. Note that the left eye for P6 was not treated during the study period.
Abbreviations: P, patient; OD, right eye; OS, left eye.
Abbreviations: P, patient; OD, right eye; OS, left eye.
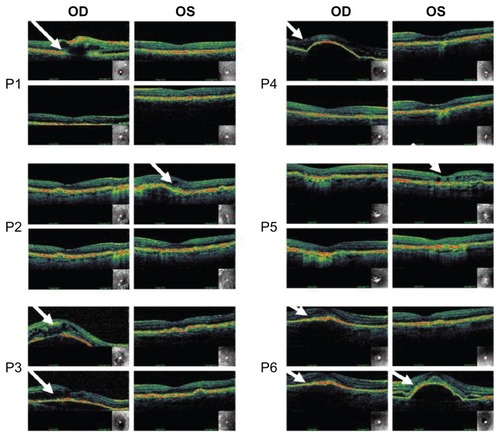
Table 2 Retinal thickness (μM) in individual patients measured with optical coherence tomography before and after injection in the treated and nontreated eyes
Figure 2 VEP in the Oz-FCz derivation before (thin line) and after (thick line) anti-VEFG treatment from the treated and nontreated eyes of six patients.
Notes: The waveforms are the average of the about 240 sweeps presented in the two trials. The bars indicate the time ranges over which the curves differ statistically at the probability level of P < 0.05 at least over 8 ms. The dark grey bars correspond to changes consistent with improved vision (ie, with a decrease in P100 latency and/or an increase in P100 amplitude), whereas the light bars correspond to opposite changes. The white bars correspond to changes outside the P100 component. In 5/6 patients, statistically significant changes consistent with improved vision in the treated eye were observed. Note that in P6, there had been a deterioration of vision in the untreated eye between the recordings leading to large changes in VEP from that eye.
Abbreviations: VEP, visual evoked potentials; P, patient number.
Abbreviations: VEP, visual evoked potentials; P, patient number.
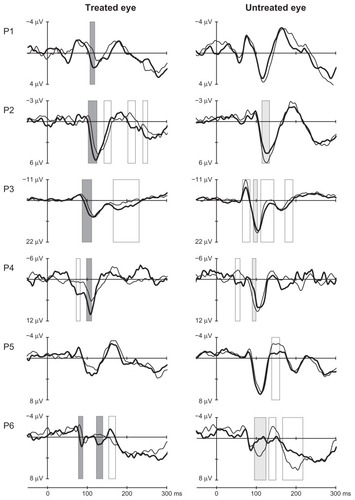
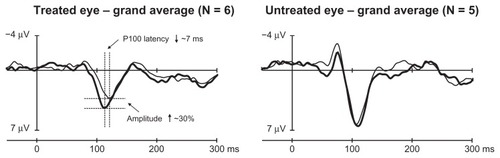
Figure 3 Grand average waveforms of individual waveforms from .
Notes: The improvement due to the treatment is reflected by the shortening of the P100 latency by about 7 ms and by its amplitude increase of about 30%. Due to a small number of subjects in the grand average and their large individual variation, the spread of the average data is so large that the curves and the numbers presented are only for illustration and have no statistical significance.