Figures & data
Figure 1 Total corneal (left) and epithelial (right) three-dimensional pachymetry maps. Top, a right eye with topographic variability of 8.4 μm and epithelial range of −28 μm, classified as KC2 (IHD =0.065, ISV =64); bottom, a right eye with topographic variability of 9.6 μm and epithelial range of −30 μm, classified as KC3 (IHD =0.107, ISV =104).
Abbreviations: IHD, index of height decentration; ISV, index of surface variance.
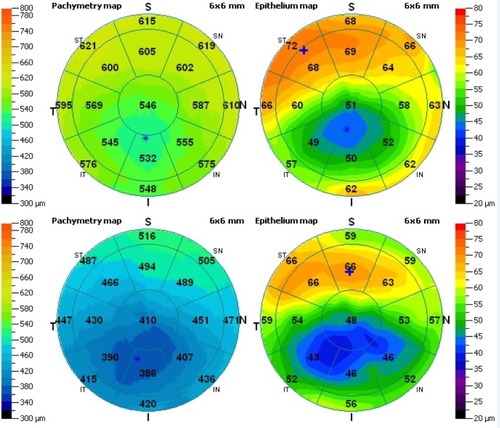
Table 1 Intraindividual-repeatability descriptive statistics for epithelial thickness, as computed by the standard deviation of the respective values obtained by four consecutive acquisitions per eye
Figure 2 Box plots of epithelial thickness (showing center, superior, inferior, minimum, maximum, mean, and peripheral) showing median level (⊗), average (⊕), 95% median confidence, and interquartile interval range boxes. Top, keratoconic group; bottom, control group.
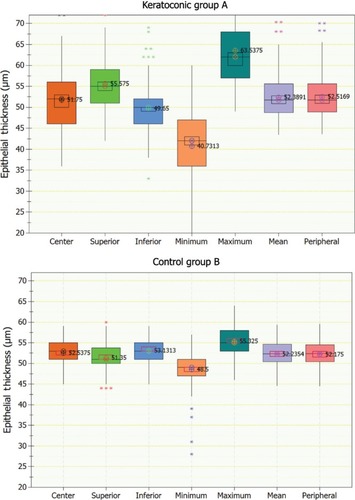
Table 2 Central epithelial thickness (center), superior, inferior, minimum, maximum, topographic thickness variability, range, mean, and peripheral for the two study groups (control and keratoconus [KCN])
Figure 3 Box plots of epithelial thickness topographic variability (top) and range, defined as minimum minus maximum (bottom) for the two groups. Graphs include median level (⊗), average (⊕), 95% median confidence, and interquartile interval range boxes.
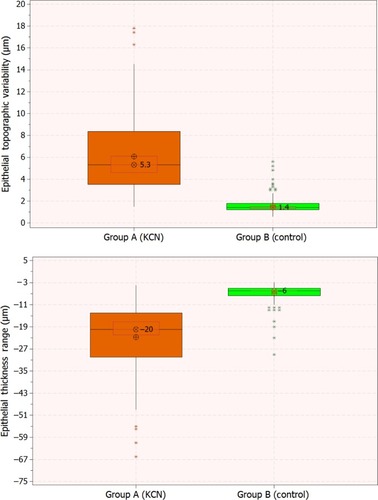
Figure 4 Scatter and fitted-line plots of topographic epithelial thickness variability versus index of height decentration (IHD; top) and index of surface variance (ISV; bottom). Graphs include regression, 95% confidence interval (CI), and 95% prediction interval (PI) lines.
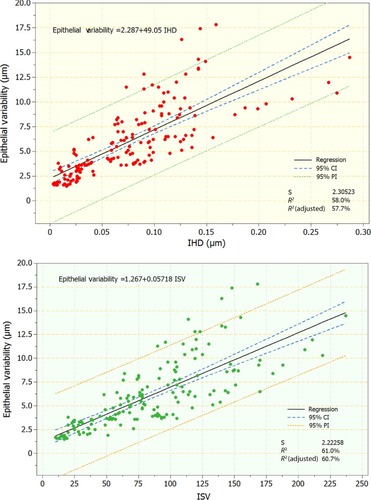
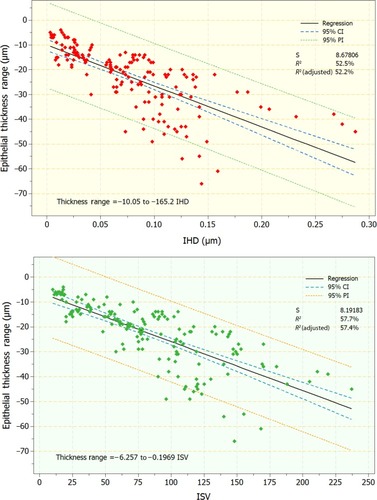
Figure 5 Scatter and fitted-line plots of topographic epithelial thickness range versus index of height decentration (IHD; top) and index of surface variance (ISV; bottom). Graphs include regression, 95% confidence interval (CI), and 95% prediction interval (PI) lines.